Aflac 2008 Annual Report Download - page 56
Download and view the complete annual report
Please find page 56 of the 2008 Aflac annual report below. You can navigate through the pages in the report by either clicking on the pages listed below, or by using the keyword search tool below to find specific information within the annual report.-
 1
1 -
2
-
3
-
4
-
5
-
6
-
7
-
8
-
9
-
10
-
11
-
12
-
13
-
14
-
15
-
16
-
17
-
18
-
19
-
20
-
21
-
22
-
23
-
24
-
25
-
26
-
27
-
28
-
29
-
30
-
31
-
32
-
33
-
34
-
35
-
36
-
37
-
38
-
39
-
40
-
41
-
42
-
43
-
44
-
45
-
 46
46 -
 47
47 -
 48
48 -
 49
49 -
 50
50 -
 51
51 -
 52
52 -
 53
53 -
 54
54 -
 55
55 -
 56
56 -
 57
57 -
 58
58 -
 59
59 -
 60
60 -
 61
61 -
 62
62 -
 63
63 -
 64
64 -
 65
65 -
 66
66 -
67
-
68
-
69
-
70
-
71
-
72
-
73
-
74
-
75
-
76
-
77
-
78
-
79
-
80
-
81
-
82
-
83
-
84
-
85
-
86
-
87
-
88
-
89
-
90
-
91
-
92
-
93
-
94
-
95
-
96
-
97
-
98
-
99
-
100
-
101
-
102
 |
 |

52 Aflac Incorporated Annual Report for 2008
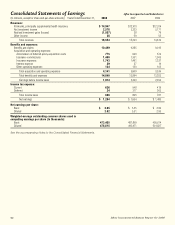
Consolidated Statements of Earnings Aflac Incorporated and Subsidiaries
(In millions, except for share and per-share amounts) Years Ended December 31, 2008 2007 2006
Revenues:
Premiums, principally supplemental health insurance $ 14,947 $ 12,973 $ 12,314
Net investment income 2,578 2,333 2,171
Realized investment gains (losses) (1,007) 28 79
Other income 36 59 52
Total revenues 16,554 15,393 14,616
Benefits and expenses:
Benefits and claims 10,499 9,285 9,016
Acquisition and operating expenses:
Amortization of deferred policy acquisition costs 775 640 574
Insurance commissions 1,460 1,331 1,303
Insurance expenses 1,743 1,491 1,337
Interest expense 29 27 19
Other operating expenses 134 120 103
Total acquisition and operating expenses 4,141 3,609 3,336
Total benefits and expenses 14,640 12,894 12,352
Earnings before income taxes 1,914 2,499 2,264
Income tax expense:
Current 636 548 419
Deferred 24 317 362
Total income taxes 660 865 781
Net earnings $ 1,254 $ 1,634 $ 1,483
Net earnings per share:
Basic $ 2.65 $ 3.35 $ 2.99
Diluted 2.62 3.31 2.95
Weighted-average outstanding common shares used in
computing earnings per share (In thousands):
Basic 473,405 487,869 495,614
Diluted 478,815 493,971 501,827
See the accompanying Notes to the Consolidated Financial Statements.