Aflac 2008 Annual Report Download - page 20
Download and view the complete annual report
Please find page 20 of the 2008 Aflac annual report below. You can navigate through the pages in the report by either clicking on the pages listed below, or by using the keyword search tool below to find specific information within the annual report.-
 1
1 -
2
-
3
-
4
-
5
-
6
-
7
-
8
-
9
-
 10
10 -
 11
11 -
 12
12 -
 13
13 -
 14
14 -
 15
15 -
 16
16 -
 17
17 -
 18
18 -
 19
19 -
 20
20 -
 21
21 -
 22
22 -
 23
23 -
 24
24 -
 25
25 -
 26
26 -
 27
27 -
 28
28 -
 29
29 -
 30
30 -
31
-
32
-
33
-
34
-
35
-
36
-
37
-
38
-
39
-
40
-
41
-
42
-
43
-
44
-
45
-
46
-
47
-
48
-
49
-
50
-
51
-
52
-
53
-
54
-
55
-
56
-
57
-
58
-
59
-
60
-
61
-
62
-
63
-
64
-
65
-
66
-
67
-
68
-
69
-
70
-
71
-
72
-
73
-
74
-
75
-
76
-
77
-
78
-
79
-
80
-
81
-
82
-
83
-
84
-
85
-
86
-
87
-
88
-
89
-
90
-
91
-
92
-
93
-
94
-
95
-
96
-
97
-
98
-
99
-
100
-
101
-
102
 |
 |

Aflac U.S.
16 Aflac Incorporated Annual Report for 2008
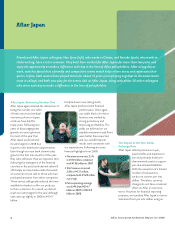
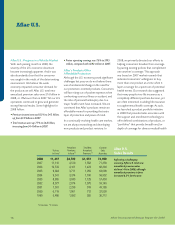
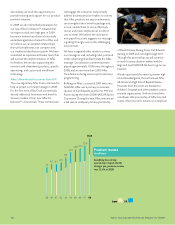
Aflac U.S.: Progress in a Volatile Market
With each passing month in 2008, the
severity of the U.S. economic downturn
became increasingly apparent. And it was
also abundantly clear that the consumer
was caught in the midst of the deteriorating
environment. We believe the weak
economy impacted consumer demand for
the products we sell. Aflac U.S. total new
annualized premium sales were $1.6 billion in
2008, or .4% lower than in 2007. Yet our U.S.
operations continued to grow and generate
strong financial results. Some highlights for
2008 follow:
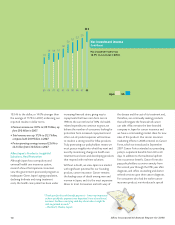
•Premiumincomeincreased8.5%to$4.3billion,
up from $3.9 billion in 2007.
•Totalrevenueswereup7.7%to$4.8billion,
increasing from $4.4 billion in 2007.
•Pretaxoperatingearningsrose7.6%to$745
million, compared with $692 million in 2007.
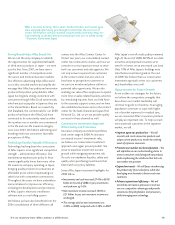
Aflac’s Products Offer
Affordable Protection
Although the U.S. economy posed significant
challenges last year, we do not believe there
was a fundamental change in the need for
our protection-oriented products. Consumers
still face rising out-of-pocket expenses when
confronting a serious illness or accident, and
the risks of personal bankruptcy due to a
major health event have increased. We are
convinced that Aflac’s products remain an
affordable means for providing that extra
layer of protection and peace of mind.
In a continually evolving health care market,
we are always researching and developing
new products and product revisions. In
2008, we primarily directed our efforts to
helping consumers broaden their coverage
by pairing existing policies that complement
one another’s coverage. This approach
was based on 2007 market research that
indicated consumers’ willingness to buy
more than one product at a time when it
layers coverage for a spectrum of potential
health events. Our research also suggested
that many people view life insurance as a
completely different purchase decision, yet
are often interested in adding life insurance
to supplemental health coverage. As such,
we launched a product portfolio initiative
in 2008 that provided sales associates with
the support and enrollment technology to
offer defined combinations of products, or
“portfolios” that provide breadth and/or
depth of coverage for diverse medical health
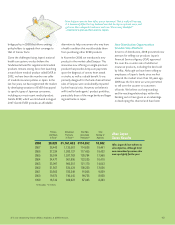
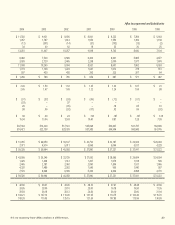
Annualized Total New Licensed
Policies Premiums Annualized Sales
In Force* In Force** Premiums** Associates
2008 11,437 $4,789 $1,551 74,390
2007 11,116 4,510 1,558 71,258
2006 10,519 4,101 1,423 68,394
2005 9,884 3,711 1,259 63,008
2004 9,341 3,374 1,186 58,992
2003 8,805 3,043 1,128 57,493
2002 8,077 2,674 1,070 53,149
2001 7,031 2,238 919 43,188
2000 6,119 1,861 712 37,509
1999 5,480 1,592 555 30,712
*In thousands **In millions
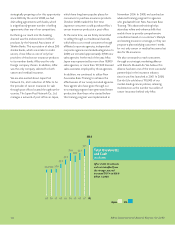
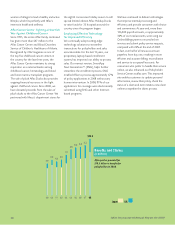
Aflac U.S.
Sales Results
Reflecting a challenging
economy, Aflac U.S. total new
annualized premium sales
declined .4% in 2008, although
annualized premiums in force
increased 6.2% for the year.