Aflac 2008 Annual Report Download - page 38
Download and view the complete annual report
Please find page 38 of the 2008 Aflac annual report below. You can navigate through the pages in the report by either clicking on the pages listed below, or by using the keyword search tool below to find specific information within the annual report.
34 Aflac Incorporated Annual Report for 2008
AFLAC U.S. SEGMENT
Aflac U.S. Pretax Operating Earnings
Changes in Aflac U.S. pretax operating earnings and profit
margins are primarily affected by morbidity, mortality,
expenses, persistency and investment yields. The following
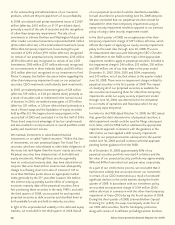
table presents a summary of operating results for Aflac U.S.
The percentage increases in premium income reflect the
growth of premiums in force. The increases in annualized
premiums in force of 6.2% in 2008, 10.0% in 2007 and 10.5%
in 2006 were favorably affected by sales at the worksite and
a slight improvement in the persistency of several products.
Annualized premiums in force at December 31 were $4.8
billion in 2008, compared with $4.5 billion in 2007 and $4.1
billion in 2006. Net investment income was relatively flat
during 2008, primarily as a result of funds utilized in our
accelerated share repurchase programs in the first and third
quarters of 2008. For further information, see the Capital
Resources and Liquidity section of this MD&A and Note 9 of
the Notes to the Consolidated Financial Statements.
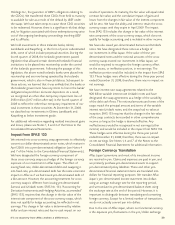
The table at the top of the next column presents a summary
of operating ratios for Aflac U.S.
The benefit ratio, operating expense ratio and pretax
operating profit margin for 2008 were relatively stable,
compared with 2007. We expect the benefit ratio to decline
modestly and the operating expense ratio and pretax
operating profit margin to increase slightly in 2009.
Aflac U.S. Sales
In 2008, we believe the weak economy had a negative effect
on the demand for the products we sell, resulting in a slight
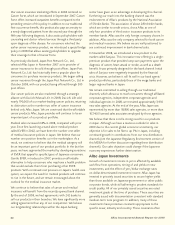
decrease in new annualized premium sales. The following table
presents Aflac’s U.S. total new annualized premium sales for
the years ended December 31.
Although we have a cautious outlook for sales in 2009 due
to the current global economic uncertainty, our objective is
for total new annualized premium sales to be flat to up 5% in
the U.S. Our sales objective could change if the U.S. economy
experiences further deterioration.
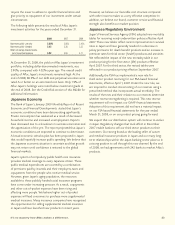
The following table details the contributions to total new
annualized premium sales by major product category for the
years ended December 31.
Total new annualized premium sales for accident/disability,
our leading product category, decreased 4.8% in 2008, while
cancer expense insurance increased 4.2% and our hospital
indemnity category increased 13.6%, compared with 2007.
One aspect of our growth strategy is the continued
enhancement of our product line. In 2008, we primarily
directed our efforts to helping consumers broaden their
coverage by pairing existing policies that complement one
another’s coverage. We launched a product portfolio initiative
in 2008 that provided sales associates with the support and
enrollment technology to offer defined combinations of
products, or “portfolios,” that provide breadth and/or depth
Aflac U.S. Summary of Operating Results
(In millions) 2008 2007 2006
Premium income $ 4,272 $ 3,936 $ 3,552
Net investment income 505 500 465
Other income 10 10 10
Total operating revenues 4,787 4,446 4,027
Benefits and claims 2,527 2,350 2,169
Operating expenses:
Amortization of deferred policy acquisition costs 370 323 290
Insurance commissions 488 481 444
Insurance and other expenses 657 600 539
Total operating expenses 1,515 1,404 1,273
Total benefits and expenses 4,042 3,754 3,442
Pretax operating earnings* $ 745 $ 692 $ 585
Percentage change over previous year:
Premium income 8.5% 10.8% 9.5%
Net investment income .9 7.5 10.4
Total operating revenues 7.7 10.4 9.5
Pretax operating earnings* 7.6 18.3 11.4
*See Page 30 for our definition of segment operating earnings.
Ratios to total revenues: 2008 2007 2006
Benefits and claims 52.8% 52.9% 53.9%
Operating expenses:
Amortization of deferred policy acquisition costs 7.7 7.3 7.2
Insurance commissions 10.2 10.8 11.0
Insurance and other expenses 13.7 13.4 13.4
Total operating expenses 31.6 31.5 31.6
Pretax operating earnings* 15.6 15.6 14.5
*See Page 30 for our definition of segment operating earnings.
(In millions) 2008 2007 2006
Total new annualized premium sales $ 1,551 $ 1,558 $ 1,423
Increase (decrease) over prior year (.4)% 9.5% 13.1%
2008 2007 2006
Accident/disability coverage 49% 51% 52%
Cancer expense insurance 19 18 17
Hospital indemnity products 16 14 12
Fixed-benefit dental coverage 5 6 6
Other 11 11 13
Total 100% 100% 100%


