Aflac 2008 Annual Report Download - page 67
Download and view the complete annual report
Please find page 67 of the 2008 Aflac annual report below. You can navigate through the pages in the report by either clicking on the pages listed below, or by using the keyword search tool below to find specific information within the annual report.-
 1
1 -
2
-
3
-
4
-
5
-
6
-
7
-
8
-
9
-
10
-
11
-
12
-
13
-
14
-
15
-
16
-
17
-
18
-
19
-
20
-
21
-
22
-
23
-
24
-
25
-
26
-
27
-
28
-
29
-
30
-
31
-
32
-
33
-
34
-
35
-
36
-
37
-
38
-
39
-
40
-
41
-
42
-
43
-
44
-
45
-
46
-
47
-
48
-
49
-
50
-
51
-
52
-
53
-
54
-
55
-
56
-
 57
57 -
 58
58 -
 59
59 -
 60
60 -
 61
61 -
 62
62 -
 63
63 -
 64
64 -
 65
65 -
 66
66 -
 67
67 -
 68
68 -
 69
69 -
 70
70 -
 71
71 -
 72
72 -
 73
73 -
 74
74 -
 75
75 -
 76
76 -
 77
77 -
78
-
79
-
80
-
81
-
82
-
83
-
84
-
85
-
86
-
87
-
88
-
89
-
90
-
91
-
92
-
93
-
94
-
95
-
96
-
97
-
98
-
99
-
100
-
101
-
102
 |
 |

63
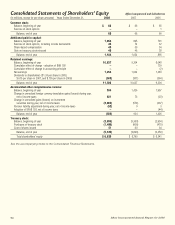
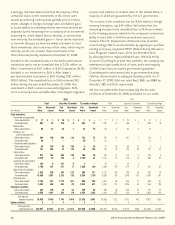
It’s no mystery how Aflac makes a difference.
(In millions) 2008 2007 2006
Revenues:
Aflac Japan:
Earned premiums:
Cancer $ 5,718 $ 4,937 $ 4,923
Other accident and health 3,547 2,928 2,755
Life insurance 1,409 1,172 1,084
Net investment income 2,053 1,801 1,688
Other income 15 27 25
Total Aflac Japan 12,742 10,865 10,475
Aflac U.S.:
Earned premiums:
Accident/disability 1,941 1,785 1,580
Cancer expense 1,197 1,114 1,041
Other health 958 885 801
Life insurance 176 152 130
Net investment income 505 500 465
Other income 10 10 10
Total Aflac U.S. 4,787 4,446 4,027
Other business segments 38 37 42
Total business segments 17,567 15,348 14,544
Realized investment gains (losses) (1,007) 28 79
Corporate 85 116 87
Intercompany eliminations (91) (99) (94)
Total revenues $ 16,554 $ 15,393 $ 14,616
(In millions) 2008 2007 2006
Pretax Earnings:
Aflac Japan $ 2,250 $ 1,821 $ 1,652
Aflac U.S. 745 692 585
Other business segments (1) – 5
Total business segments 2,994 2,513 2,242
Interest expense, noninsurance operations (26) (21) (17)
Corporate and eliminations (42) (25) (40)
Pretax operating earnings 2,926 2,467 2,185
Realized investment gains (losses) (1,007) 28 79
Impact from SFAS 133 (5) 4 –
Total earnings before income taxes $ 1,914 $ 2,499 $ 2,264
Income taxes applicable to pretax operating earnings $ 1,015 $ 854 $ 753
Effect of foreign currency translation on
operating earnings 111 (11) (39)
Assets as of December 31 were as follows:
(In millions) 2008 2007
Assets:
Aflac Japan $ 69,141 $ 54,153
Aflac U.S. 9,679 10,415
Other business segments 166 117
Total business segments 78,986 64,685
Corporate 8,716 10,364
Intercompany eliminations (8,371) (9,244)
Total assets $ 79,331 $ 65,805
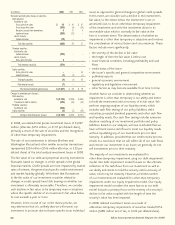
Yen-Translation Effects: The following table shows the
yen/dollar exchange rates used for or during the periods
ended December 31. Exchange effects were calculated using
the same yen/dollar exchange rate for the current year as for
each respective prior year.
2008 2007 2006
Statements of Earnings:
Weighted-average yen/dollar exchange rate 103.46 117.93 116.31
Yen percent strengthening (weakening) 14.0% (1.4)% (5.5)%
Exchange effect on net earnings (millions) $ 55 $ (10) $ (41)
2008 2007
Balance Sheets:
Yen/dollar exchange rate at December 31 91.03 114.15
Yen percent strengthening (weakening) 25.4% 4.3%
Exchange effect on total assets (millions) $ 13,312 $ 2,102
Exchange effect on total liabilities (millions) 13,180 2,063
Aflac Japan maintains a portfolio of dollar-denominated
securities, which serves as an economic currency hedge of a
portion of our investment in Aflac Japan. We have designated
the Parent Company’s yen-denominated notes payable and
cross-currency swaps as a hedge of our investment in Aflac
Japan. The dollar values of our yen-denominated net assets,
which are subject to foreign currency translation fluctuations
for financial reporting purposes, are summarized as follows at
December 31 (translated at end-of-period exchange rates):
(In millions) 2008 2007
Aflac Japan net assets $ 5,944 $ 6,087
Aflac Japan dollar-denominated net assets (3,416) (3,672)
Aflac Japan yen-denominated net assets 2,528 2,415
Parent Company yen-denominated net liabilities (1,876) (1,496)
Consolidated yen-denominated net assets subject to
foreign currency translation fluctuations $ 652 $ 919
Transfers of funds from Aflac Japan: Aflac Japan makes
payments to the Parent Company for management fees and
to Aflac U.S. for allocated expenses and profit repatriations.
Information on transfers for each of the years ended
December 31 is shown below. See Note 11 for information
concerning restrictions on transfers from Aflac Japan.
(In millions) 2008 2007 2006
Management fees $ 26 $ 32 $ 25
Allocated expenses 36 33 32
Profit repatriation 598 567 442
Total transfers from Aflac Japan $ 660 $ 632 $ 499
Policyholder Protection Corporation: The total liability
accrued for our obligations to the Japanese Life Insurance
Policyholder Protection Corporation (LIPPC) was $161 million
(¥14.6 billion) at December 31, 2008, compared with $151
million (¥17.2 billion) a year ago. The obligation is payable in
semi-annual installments through 2013.