Aflac 2008 Annual Report Download - page 43
Download and view the complete annual report
Please find page 43 of the 2008 Aflac annual report below. You can navigate through the pages in the report by either clicking on the pages listed below, or by using the keyword search tool below to find specific information within the annual report.-
 1
1 -
2
-
3
-
4
-
5
-
6
-
7
-
8
-
9
-
10
-
11
-
12
-
13
-
14
-
15
-
16
-
17
-
18
-
19
-
20
-
21
-
22
-
23
-
24
-
25
-
26
-
27
-
28
-
29
-
30
-
31
-
32
-
 33
33 -
 34
34 -
 35
35 -
 36
36 -
 37
37 -
 38
38 -
 39
39 -
 40
40 -
 41
41 -
 42
42 -
 43
43 -
 44
44 -
 45
45 -
 46
46 -
 47
47 -
 48
48 -
 49
49 -
 50
50 -
 51
51 -
 52
52 -
 53
53 -
54
-
55
-
56
-
57
-
58
-
59
-
60
-
61
-
62
-
63
-
64
-
65
-
66
-
67
-
68
-
69
-
70
-
71
-
72
-
73
-
74
-
75
-
76
-
77
-
78
-
79
-
80
-
81
-
82
-
83
-
84
-
85
-
86
-
87
-
88
-
89
-
90
-
91
-
92
-
93
-
94
-
95
-
96
-
97
-
98
-
99
-
100
-
101
-
102
 |
 |

39
It’s no mystery how Aflac makes a difference.
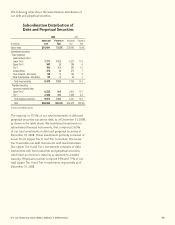
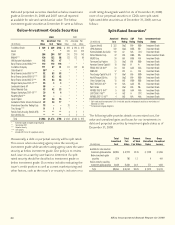
The following table shows the subordination distribution of
our debt and perpetual securities.
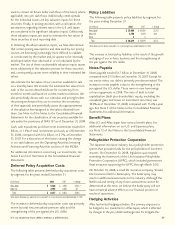
The majority, or 73.5%, of our total investments in debt and
perpetual securities was senior debt, as of December 31, 2008,
as shown in the table above. We maintained investments in
subordinated financial instruments, that comprised 26.5%
of our total investments in debt and perpetual securities at
December 31, 2008. These investments primarily consisted of
Lower Tier II, Upper Tier II, and Tier I securities. The Lower
Tier II securities are debt instruments with fixed maturities.
Our Upper Tier II and Tier I investments consisted of debt
instruments with fixed maturities and perpetual securities,
which have an economic maturity as opposed to a stated
maturity. Perpetual securities comprise 95% and 77% of our
total Upper Tier II and Tier I investments, respectively as of
December 31, 2008.
Subordination Distribution of
Debt and Perpetual Securities
2008
2007
Amortized Percent of Amortized Percent of
(In millions) Cost Total Cost Total
Senior notes $ 51,091 73.5% $ 38,483 70.6%
Subordinated securities:
Fixed maturities
(stated maturity date):
Lower Tier II 7,777 11.2 6,277 11.5
Upper Tier II 340 .5 296 .6
Tier I* 750 1.1 582 1.0
Surplus Notes 374 .5 375 .7
Trust Preferred - Non-banks 86 .1 154 .3
Other Subordinated - Non-banks 52 .1 52 .1
Total fixed maturities 9,379 13.5 7,736 14.2
Perpetual securities
(economic maturity date):
Upper Tier II 6,532 9.4 5,812 10.7
Tier I 2,542 3.6 2,439 4.5
Total perpetual securities 9,074 13.0 8,251 15.2
Total $ 69,544 100.0% $ 54,470 100.0%
* Includes Trust Preferred securities