Aflac 2008 Annual Report Download - page 57
Download and view the complete annual report
Please find page 57 of the 2008 Aflac annual report below. You can navigate through the pages in the report by either clicking on the pages listed below, or by using the keyword search tool below to find specific information within the annual report.-
 1
1 -
2
-
3
-
4
-
5
-
6
-
7
-
8
-
9
-
10
-
11
-
12
-
13
-
14
-
15
-
16
-
17
-
18
-
19
-
20
-
21
-
22
-
23
-
24
-
25
-
26
-
27
-
28
-
29
-
30
-
31
-
32
-
33
-
34
-
35
-
36
-
37
-
38
-
39
-
40
-
41
-
42
-
43
-
44
-
45
-
46
-
 47
47 -
 48
48 -
 49
49 -
 50
50 -
 51
51 -
 52
52 -
 53
53 -
 54
54 -
 55
55 -
 56
56 -
 57
57 -
 58
58 -
 59
59 -
 60
60 -
 61
61 -
 62
62 -
 63
63 -
 64
64 -
 65
65 -
 66
66 -
 67
67 -
68
-
69
-
70
-
71
-
72
-
73
-
74
-
75
-
76
-
77
-
78
-
79
-
80
-
81
-
82
-
83
-
84
-
85
-
86
-
87
-
88
-
89
-
90
-
91
-
92
-
93
-
94
-
95
-
96
-
97
-
98
-
99
-
100
-
101
-
102
 |
 |

53
It’s no mystery how Aflac makes a difference.
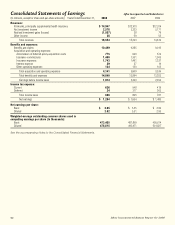
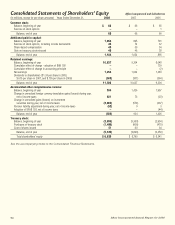
Consolidated Balance Sheets Aflac Incorporated and Subsidiaries
(In millions, except for share and per-share amounts) December 31, 2008 2007
Assets:
Investments and cash:
Securities available for sale, at fair value:
Fixed maturities (amortized cost $36,034 in 2008 and $29,399 in 2007) $ 35,012 $ 30,511
Perpetual securities (amortized cost $9,074 in 2008 and $4,267 in 2007) 8,047 4,089
Equity securities (cost $24 in 2008 and $21 in 2007) 27 28
Securities held to maturity, at amortized cost:
Fixed maturities (fair value $23,084 in 2008 and $16,191 in 2007) 24,436 16,819
Perpetual securities (fair value $3,934 in 2007) – 3,985
Other investments 87 61
Cash and cash equivalents 941 1,563
Total investments and cash 68,550 57,056
Receivables, primarily premiums 920 732
Accrued investment income 650 561
Deferred policy acquisition costs 8,237 6,654
Property and equipment, at cost less accumulated depreciation 597 496
Other 377 306
Total assets $ 79,331 $ 65,805
Liabilities and shareholders’ equity:
Liabilities:
Policy liabilities:
Future policy benefits $ 59,310 $ 45,675
Unpaid policy claims 3,118 2,455
Unearned premiums 874 693
Other policyholders’ funds 2,917 1,853
Total policy liabilities 66,219 50,676
Notes payable 1,721 1,465
Income taxes 1,201 2,531
Payables for return of cash collateral on loaned securities 1,733 808
Other 1,818 1,530
Commitments and contingent liabilities (Note 13)
Total liabilities 72,692 57,010
Shareholders’ equity:
Common stock of $.10 par value. In thousands: authorized 1,900,000 shares in 2008 and
1,000,000 shares in 2007; issued 660,035 shares in 2008 and 658,604 shares in 2007 66 66
Additional paid-in capital 1,184 1,054
Retained earnings 11,306 10,637
Accumulated other comprehensive income:
Unrealized foreign currency translation gains 750 129
Unrealized gains (losses) on investment securities (1,211) 874
Pension liability adjustment (121) (69)
Treasury stock, at average cost (5,335) (3,896)
Total shareholders’ equity 6,639 8,795
Total liabilities and shareholders’ equity $ 79,331 $ 65,805
See the accompanying Notes to the Consolidated Financial Statements.