Aflac 2008 Annual Report Download - page 35
Download and view the complete annual report
Please find page 35 of the 2008 Aflac annual report below. You can navigate through the pages in the report by either clicking on the pages listed below, or by using the keyword search tool below to find specific information within the annual report.-
 1
1 -
2
-
3
-
4
-
5
-
6
-
7
-
8
-
9
-
10
-
11
-
12
-
13
-
14
-
15
-
16
-
17
-
18
-
19
-
20
-
21
-
22
-
23
-
24
-
 25
25 -
 26
26 -
 27
27 -
 28
28 -
 29
29 -
 30
30 -
 31
31 -
 32
32 -
 33
33 -
 34
34 -
 35
35 -
 36
36 -
 37
37 -
 38
38 -
 39
39 -
 40
40 -
 41
41 -
 42
42 -
 43
43 -
 44
44 -
 45
45 -
46
-
47
-
48
-
49
-
50
-
51
-
52
-
53
-
54
-
55
-
56
-
57
-
58
-
59
-
60
-
61
-
62
-
63
-
64
-
65
-
66
-
67
-
68
-
69
-
70
-
71
-
72
-
73
-
74
-
75
-
76
-
77
-
78
-
79
-
80
-
81
-
82
-
83
-
84
-
85
-
86
-
87
-
88
-
89
-
90
-
91
-
92
-
93
-
94
-
95
-
96
-
97
-
98
-
99
-
100
-
101
-
102
 |
 |

31
It’s no mystery how Aflac makes a difference.
premiums in force at December 31, 2008, were ¥1.16 trillion,
compared with ¥1.13 trillion in 2007 and ¥1.08 trillion in
2006. Annualized premiums in force, translated into dollars at
respective year-end exchange rates, were $12.8 billion in 2008,
$9.9 billion in 2007, and $9.1 billion in 2006.
Aflac Japan maintains a portfolio of dollar-denominated
and reverse-dual currency securities (yen-denominated debt
securities with dollar coupon payments). Dollar-denominated
investment income from these assets accounted for
approximately 36% of Aflac Japan’s investment income in
2008, compared with 39% in 2007 and 37% in 2006. In years
when the yen strengthens in relation to the dollar, translating
Aflac Japan’s dollar-denominated investment income into
yen lowers growth rates for net investment income, total
operating revenues, and pretax operating earnings in yen
terms. In years when the yen weakens, translating dollar-
denominated investment income into yen magnifies growth
rates for net investment income, total operating revenues,
and pretax operating earnings in yen terms. On a constant
currency basis, dollar-denominated investment income
accounted for approximately 39% of Aflac Japan’s investment
income during 2008, compared with 39% in 2007 and 36%
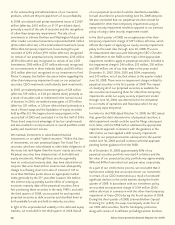
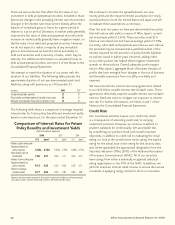
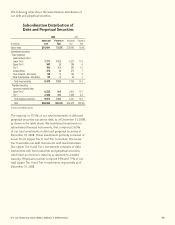
in 2006. The following table illustrates the effect of translating
Aflac Japan’s dollar-denominated investment income and
related items into yen by comparing certain segment results
with those that would have been reported had yen/dollar
exchange rates remained unchanged from the prior year.
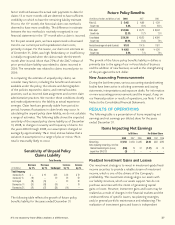
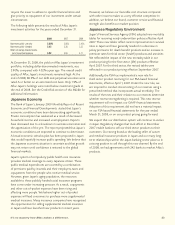
The following table presents a summary of operating ratios for
Aflac Japan.
The benefit ratio has declined over the past several years,
reflecting the impact of newer products and riders with lower
loss ratios. We have also experienced favorable claim trends in
our major product lines. We expect the improvement in the
benefit ratio to continue as we shift to newer products and
riders and benefit from the impact of favorable claim trends.
However, this improvement is partially offset by the effect
of low investment yields, which impacts our profit margin by
reducing the spread between investment yields and required
interest on policy reserves (see table and discussion in the
Interest Rate Risk section of this MD&A). The operating
expense ratio increased modestly in 2008 in line with our
expectations and primarily reflects the increased costs
associated with IT infrastructure changes and our preparation
for sales through the bank channel. We expect the operating
expense ratio to increase slightly in 2009. Due to continued
improvement in the benefit ratio, the pretax operating profit
margin expanded in 2008. We expect continued expansion in
the profit margin in 2009.
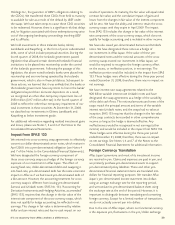
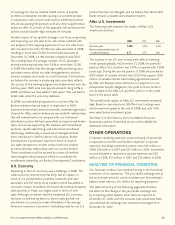
Aflac Japan Sales
Our stated objective for 2008 was to increase sales 3% to
7%. We had anticipated growth from new sales distribution
opportunities; however, our new bank channel sales were lower
than expected and were negatively affected by the emergence
of the financial crisis late in the year. Despite sales increasing
slightly to ¥114.7 billion, we did not reach our sales target for
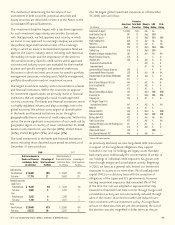
2008. The following table presents Aflac Japan’s total new
annualized premium sales for the years ended December 31.
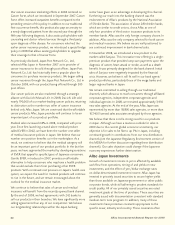
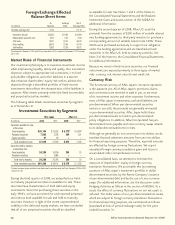
The following table details the contributions to total new
annualized premium sales by major product for the years
ended December 31.
Cancer insurance was our top-selling product category for Aflac
Japan in 2008 with sales rising 3.6% over 2007. Aflac remains
the best branded company in Japan for cancer insurance.
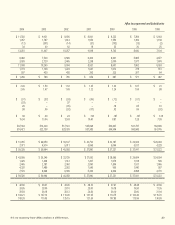
Aflac Japan Percentage
Changes Over Prior Year
(Yen Operating Results)
Including Foreign Excluding Foreign
Currency Changes *Currency Changes**
2008 2007 2006 2008 2007 2006
Net investment income –% 8.0% 9.0% 5.0% 7.4% 6.8%
Total operating revenues 2.8 4.9 6.3 3.8 4.9 6.0
Pretax operating earnings* 8.4 11.8 15.4 13.8 11.3 13.3
*See Page 30 for our definition of segment operating earnings.
**Amounts excluding foreign currency changes on dollar-denominated items were determined using the same yen/dollar
**exchange rate for the current year as each respective prior year.
Ratios to total revenues: 2008 2007 2006
Benefits and claims 62.5% 63.8% 65.4%
Operating expenses:
Amortization of deferred policy acquisition costs 3.2 2.9 2.7
Insurance commissions 7.6 7.8 8.2
Insurance and other expenses 9.0 8.7 7.9
Total operating expenses 19.8 19.4 18.8
Pretax operating earnings* 17.7 16.8 15.8
*See Page 30 for our definition of segment operating earnings.
In Dollars In Yen
(In millions of dollars
and billions of yen) 2008 2007 2006 2008 2007 2006
Total new annualized
premium sales $ 1,115 $ 974 $ 1,010 ¥114.7 ¥ 114.6 ¥ 117.5
Percentage change
over prior year 14.4% (3.5)% (13.5)% –% (2.4)% (8.8)%
2008 2007 2006
Medical policies 34% 33% 33%
Cancer 34 33 28
Ordinary life 23 22 23
Rider MAX 5 7 10
Other 4 5 6
Total 100% 100% 100%