Aflac 2008 Annual Report Download - page 39
Download and view the complete annual report
Please find page 39 of the 2008 Aflac annual report below. You can navigate through the pages in the report by either clicking on the pages listed below, or by using the keyword search tool below to find specific information within the annual report.-
 1
1 -
2
-
3
-
4
-
5
-
6
-
7
-
8
-
9
-
10
-
11
-
12
-
13
-
14
-
15
-
16
-
17
-
18
-
19
-
20
-
21
-
22
-
23
-
24
-
25
-
26
-
27
-
28
-
 29
29 -
 30
30 -
 31
31 -
 32
32 -
 33
33 -
 34
34 -
 35
35 -
 36
36 -
 37
37 -
 38
38 -
 39
39 -
 40
40 -
 41
41 -
 42
42 -
 43
43 -
 44
44 -
 45
45 -
 46
46 -
 47
47 -
 48
48 -
 49
49 -
50
-
51
-
52
-
53
-
54
-
55
-
56
-
57
-
58
-
59
-
60
-
61
-
62
-
63
-
64
-
65
-
66
-
67
-
68
-
69
-
70
-
71
-
72
-
73
-
74
-
75
-
76
-
77
-
78
-
79
-
80
-
81
-
82
-
83
-
84
-
85
-
86
-
87
-
88
-
89
-
90
-
91
-
92
-
93
-
94
-
95
-
96
-
97
-
98
-
99
-
100
-
101
-
102
 |
 |

35
It’s no mystery how Aflac makes a difference.
of coverage for diverse medical health events. A popular
portfolio combination includes pairing our accident product
in conjunction with our personal sickness indemnity product.
We are also pairing life products with any other supplemental
policy we offer. As a result of this approach, life premiums and
policies showed double-digit increases for the year.
Another aspect of our growth strategy is our focus on growing
and improving our U.S. sales force. We remain satisfied with
our progress in the ongoing expansion of our U.S. sales force.
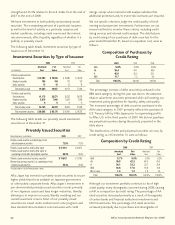
We recruited more than 25,700 new sales associates in 2008,
resulting in more than 74,300 licensed sales associates at
December 31, 2008, a 4.4% increase compared with 2007.
On a weekly basis, the average number of U.S. associates
actively producing business rose 2.6% to more than 11,200
in 2008. We believe that the average weekly producing sales
associates metric allows our sales management to actively
monitor progress and needs on a real-time basis. Furthermore,
we believe the increase in producing sales associates reflects
the success of the training programs we implemented over the
last few years. With total new payroll accounts rising 6.3% in
2008, we believe we have added “shelf space” that will lead to
better sales when the economy stabilizes.
In 2008, we intensified preparation for our new Aflac for
Brokers initiative that we expect to implement in 2009.
Insurance brokers have been a historically underleveraged sales
channel for Aflac, and we believe we can establish relationships
that will complement, not compete with, our traditional
distribution system. We have assembled an experienced broker
team, and we are supporting this initiative with streamlined
products, specific advertising, and customized enrollment
technology. Additionally, a new level of management has
been introduced in 2009 to deliver this initiative. Broker
Development Coordinators have been hired in most of
our state operations to initiate contact with new brokers
as well as develop relationships with our current brokers.
These coordinators will be assisted by a team of certified
case managers whose purpose will be to coordinate the
enrollments created by our Broker Development Coordinators.
U.S. Economy
Operating in the U.S. economy was a challenge in 2008. The
weak economic environment has likely had an impact on
some of our policyholders, potential customers and sales
associates, and the recent stock market turmoil has added to
consumer unease. In addition, Hurricane Ike severely disrupted
sales activities in Texas, our largest state in terms of new
sales. Although we believe that the weakened U.S. economy
has been a contributing factor to slower sales growth, we
also believe our products remain affordable to the average
American consumer. Consumers’ underlying need for our U.S.
product line has not changed, and we believe that the United
States remains a sizeable and attractive market.
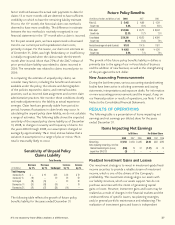
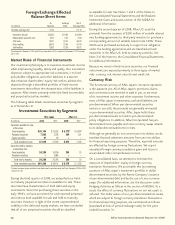
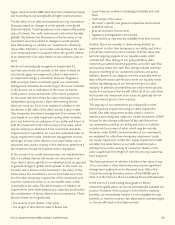
Aflac U.S. Investments
The following table presents the results of Aflac’s U.S.
investment activities.
The increase in the U.S. new money yield reflects widening
credit spreads globally. At December 31, 2008, the portfolio
yield on Aflac’s U.S. portfolio was 7.10%, compared with 7.00%
a year ago. During the second quarter of 2008, we purchased
$200 million of variable interest rate CDOs that support $200
million of variable interest rate funding agreements issued
by Aflac U.S. Because these CDOs do not support our core
policyholder benefit obligations, the yield on these CDOs is
not included in the Aflac U.S. portfolio yield or in the yields
listed in the above table.
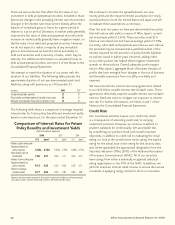
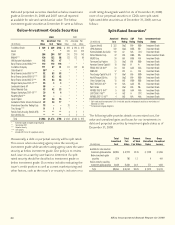
The overall credit quality of Aflac U.S. investments remained
high. Based on amortized cost, 98.4% of our holdings were
rated investment grade at the end of 2008, and only 1.6%
were rated below investment grade.
See Note 3 of the Notes to the Consolidated Financial
Statements and the Credit Risk section of this MD&A for
additional information.
OTHER OPERATIONS
Corporate operating expenses consist primarily of personnel
compensation, benefits and facilities expenses. Corporate
expenses, excluding investment income, were $61 million in
2008, $56 million in 2007 and $57 million in 2006. Investment
income included in reported corporate expenses was $20
million in 2008, $31 million in 2007 and $16 million in 2006.
ANALYSIS OF FINANCIAL CONDITION
Our financial condition has remained strong in the functional
currencies of our operations. The yen/dollar exchange rate at
the end of each period is used to translate yen-denominated
balance sheet items to U.S. dollars for reporting purposes.
The table at the top of the following page demonstrates
the effect of the change in the yen/dollar exchange rate
by comparing select balance sheet items as reported at
December 31, 2008, with the amounts that would have been
reported had the exchange rate remained unchanged from
December 31, 2007.
2008 2007 2006
New money yield 7.60% 6.44% 6.44%
Return on average invested assets, net
of investment expenses 6.77 6.79 6.86