Aflac 2008 Annual Report Download - page 88
Download and view the complete annual report
Please find page 88 of the 2008 Aflac annual report below. You can navigate through the pages in the report by either clicking on the pages listed below, or by using the keyword search tool below to find specific information within the annual report.-
 1
1 -
2
-
3
-
4
-
5
-
6
-
7
-
8
-
9
-
10
-
11
-
12
-
13
-
14
-
15
-
16
-
17
-
18
-
19
-
20
-
21
-
22
-
23
-
24
-
25
-
26
-
27
-
28
-
29
-
30
-
31
-
32
-
33
-
34
-
35
-
36
-
37
-
38
-
39
-
40
-
41
-
42
-
43
-
44
-
45
-
46
-
47
-
48
-
49
-
50
-
51
-
52
-
53
-
54
-
55
-
56
-
57
-
58
-
59
-
60
-
61
-
62
-
63
-
64
-
65
-
66
-
67
-
68
-
69
-
70
-
71
-
72
-
73
-
74
-
75
-
76
-
77
-
 78
78 -
 79
79 -
 80
80 -
 81
81 -
 82
82 -
 83
83 -
 84
84 -
 85
85 -
 86
86 -
 87
87 -
 88
88 -
 89
89 -
 90
90 -
 91
91 -
 92
92 -
 93
93 -
 94
94 -
 95
95 -
 96
96 -
 97
97 -
 98
98 -
99
-
100
-
101
-
102
 |
 |

84 Aflac Incorporated Annual Report for 2008
(In millions) 2008 2007 2006
Depreciation expense $ 57 $ 51 $ 44
Other amortization expense 17 14 15
Total depreciation and other amortization expense* $ 74 $ 65 $ 59
*Aflac Japan accounted for $43 in 2008, $37 in 2007 and $33 in 2006.
Lease and rental expense, which are included in insurance
expenses in the consolidated statements of earnings, were as
follows for the years ended December 31:
(In millions) 2008 2007 2006
Lease and rental expense:
Aflac Japan $ 68 $ 51 $ 8
Aflac U.S. 9 8 7
Other 1 – 1
Total lease and rental expense $ 78 $ 59 $ 16
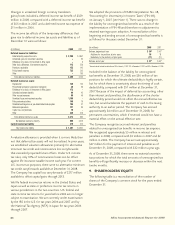
6. POLICY LIABILITIES
Our policy liabilities primarily include future policy benefits
and unpaid policy claims, which accounted for 90% and 5% of
total policy liabilities at December 31, 2008, respectively. We
regularly review the adequacy of our policy liabilities in total
and by component. The liability for future policy benefits as of
December 31 consisted of the following:
Liability Amounts Interest Rates
Policy Issue Year of In 20
(In millions) Year 2008 2007 Issue Years
Health insurance:
Japan: 2005 - 2008 $ 527 $ 284 1.5 - 2.5% 1.5 - 2.5%
1999 - 2008 9,558 6,345 3.0 3.0
1997 - 1999 3,415 2,650 3.5 3.5
1995 - 1996 367 283 4.0 4.0
1994 - 1996 4,908 3,810 4.5 4.5
1987 - 1994 21,734 17,100 5.25 - 5.5 5.25 - 5.5
1978 - 1986 5,233 4,208 6.5 - 6.75 5.5
1974 - 1979 1,015 859 7.0 5.0
U.S.: 2005 - 2008 1,562 1,107 5.5 5.5
1998 - 2004 1,048 1,023 7.0 7.0
1988 - 2004 1,016 1,057 8.0 6.0
1986 - 2004 1,405 1,377 6.0 6.0
1985 - 1986 25 25 6.5 6.5
1981 - 1986 203 210 7.0 5.5
Other 30 31
Life insurance:
Japan: 2007 - 2008 197 41 2.75 2.75
2006 - 2008 301 130 2.5 2.5
2001 - 2008 746 485 1.65 - 1.85 1.65 - 1.85
1999 - 2008 1,592 1,155 3.0 3.0
1997 - 2008 779 619 3.5 3.5
1994 - 1996 1,177 948 4.0 4.0
1985 - 1993 2,316 1,798 5.25 - 5.65 5.25 - 5.65
U.S.: 1956 - 2008 156 130 4.0 - 6.0 4.0 - 6.0
Total $ 59,310 $ 45,675
The weighted-average interest rates reflected in the
consolidated statements of earnings for future policy benefits
for Japanese policies were 4.6% in 2008, 4.6% in 2007 and
4.7% in 2006; and for U.S. policies, 6.1% in 2008, 6.2% in
2007 and 6.3% in 2006.
Changes in the liability for unpaid policy claims were as follows
for the years ended December 31:
(In millions) 2008 2007 2006
Unpaid supplemental health claims, beginning of year $ 2,332 $ 2,293 $ 2,375
Add claims incurred during the year related to:
Current year 6,127 5,225 5,045
Prior years (253) (401) (516)
Total incurred 5,874 4,824 4,529
Less claims paid during the year on claims incurred during:
Current year 4,177 3,600 3,435
Prior years 1,476 1,257 1,162
Total paid 5,653 4,857 4,597
Effect of foreign exchange rate changes on unpaid claims 406 72 (14)
Unpaid supplemental health claims, end of year 2,959 2,332 2,293
Unpaid life claims, end of year 159 123 97
Total liability for unpaid policy claims $ 3,118 $ 2,455 $ 2,390
The incurred claims development related to prior years reflects
favorable development in the unpaid policy claims liability
previously provided for. There are no additional or return of
premium considerations associated with that development.
7. NOTES PAYABLE
A summary of notes payable as of December 31 follows:
(In millions) 2008 2007
6.50% senior notes due April 2009 $ 450 $ 450
Yen-denominated Uridashi notes:
1.52% notes due September 2011 (principal amount ¥15 billion) 165 131
2.26% notes due September 2016 (principal amount ¥10 billion) 110 88
Variable interest rate notes due September 2011 (1.23% at
December 2008, principal amount ¥20 billion) 220 175
Yen-denominated Samurai notes:
.71% notes due July 2010 (principal amount ¥40 billion) 439 350
1.87% notes due June 2012 (principal amount ¥30 billion) 329 263
Capitalized lease obligations payable through 2013 8 8
Total notes payable $ 1,721 $ 1,465
The increase in total notes payable as of December 31, 2008,
compared with the prior year, is due to the change in the
yen/dollar exchange rate. There were no new borrowings or
loan repayments in 2008.
In June 2007, the Parent Company issued yen-denominated
Samurai notes totaling ¥30 billion. We used the net proceeds
of these Samurai notes to pay in full the .96% Samurai notes
that were issued in 2002 and matured in June 2007. These
Samurai notes issued by the Parent Company in 2007 and
those issued in 2005 each have five-year maturities. Each