Aflac 2008 Annual Report Download - page 6
Download and view the complete annual report
Please find page 6 of the 2008 Aflac annual report below. You can navigate through the pages in the report by either clicking on the pages listed below, or by using the keyword search tool below to find specific information within the annual report.-
 1
1 -
 2
2 -
 3
3 -
 4
4 -
 5
5 -
 6
6 -
 7
7 -
 8
8 -
 9
9 -
 10
10 -
 11
11 -
 12
12 -
 13
13 -
 14
14 -
 15
15 -
 16
16 -
 17
17 -
18
-
19
-
20
-
21
-
22
-
23
-
24
-
25
-
26
-
27
-
28
-
29
-
30
-
31
-
32
-
33
-
34
-
35
-
36
-
37
-
38
-
39
-
40
-
41
-
42
-
43
-
44
-
45
-
46
-
47
-
48
-
49
-
50
-
51
-
52
-
53
-
54
-
55
-
56
-
57
-
58
-
59
-
60
-
61
-
62
-
63
-
64
-
65
-
66
-
67
-
68
-
69
-
70
-
71
-
72
-
73
-
74
-
75
-
76
-
77
-
78
-
79
-
80
-
81
-
82
-
83
-
84
-
85
-
86
-
87
-
88
-
89
-
90
-
91
-
92
-
93
-
94
-
95
-
96
-
97
-
98
-
99
-
100
-
101
-
102
 |
 |

2Aflac Incorporated Annual Report for 2008
Another Year of Making a Difference
2008 was a year for the history books. As
2008 progressed, it became abundantly clear
that the U.S. economy was on a downward
trajectory. With the housing market rapidly
deteriorating, economic weakness took its
toll on the U.S. consumer. Then the financial
crisis erupted late in the year, which was
both unimaginable and frightening. It’s an
understatement to say that 2008 tested
virtually every company, including Aflac.
Although the global economic downturn
dampened the growth of our new policy
sales last year, we still sold more than 5.5
million policies in the United States and
Japan in 2008, generating more than $2.6
billion of new annualized premium.
A year like 2008 reminds us of why it’s so
important to stay focused on what Aflac
does best. Aflac develops and markets
affordable products consumers need to
help protect them from unexpected health-
related expenses. Furthermore, it is our
duty to invest the premiums we collect to
ensure we will always meet our policyholder
obligations. And it is our goal to operate
efficiently and generate consistent growth
that will reward our shareholders. In the best
or worst of times, our focus hasn’t changed.
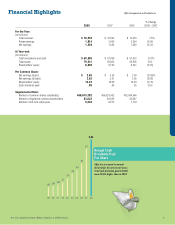
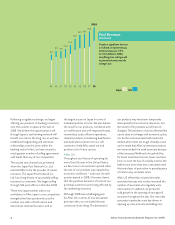
Aflac Incorporated Results
Despite the challenges Aflac faced in 2008,
we generated solid financial performance for
the year. Total revenues rose 7.5% to $16.6
billion, reflecting solid growth in premium
income and net investment income, as well
as the benefit of the stronger yen/dollar
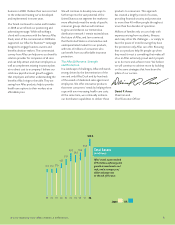
exchange rate for the year. Importantly, we
achieved the primary financial objective
we use internally to assess the growth of
our business for the 19th consecutive
year – the growth of net earnings per diluted
share, excluding items that are inherently
either uncontrollable or unpredictable. We
believe this measure best exemplifies our
management and business performance,
and that achieving it is the principal driver of
creating value for our shareholders over the
long term.
Net earnings in 2008 were $1.3 billion, or
$2.62 per diluted share, compared with
$1.6 billion, or $3.31 per share, in 2007.
The decline in net earnings for the year
resulted from sizeable realized investment
losses attributable to the financial crisis. The
realized losses primarily arose from the sale
of our holdings of Lehman Brothers debt,
and the impairments of our investments in
certain perpetual securities, collateralized
debt obligations (CDOs) and other
corporate securities.
Prior to the onset of the financial crisis, we
deployed capital to benefit our shareholders.
We bought 23.2 million of Aflac’s shares in
2008, with the purchases all funded with
internal capital. Since initiating our repurchase
Message from Management
Amounts in 2001 through 2004 have been adjusted to reflect adoption of SFAS 123R on January 1, 2005.
99 00 01 02 03 04 05 06 07 08
Net Earnings Per Diluted Share
Internal Performance Measure
1.04
1.26 1.22
1.49 1.47
2.45
2.922.95
3.31
$2.62
Net Earnings
Per Diluted Share
Net earnings benefited from record
operating results, although realized
investment losses increased sharply
in 2008. Based on the internal
financial measure we use to assess
management’s performance, which
excludes items that are either
outside management’s control
or inherently unpredictable, we
achieved our primary financial
target in 2008.