ADT 2013 Annual Report Download - page 99
Download and view the complete annual report
Please find page 99 of the 2013 ADT annual report below. You can navigate through the pages in the report by either clicking on the pages listed below, or by using the keyword search tool below to find specific information within the annual report.-
 1
1 -
2
-
3
-
4
-
5
-
6
-
7
-
8
-
9
-
10
-
11
-
12
-
13
-
14
-
15
-
16
-
17
-
18
-
19
-
20
-
21
-
22
-
23
-
24
-
25
-
26
-
27
-
28
-
29
-
30
-
31
-
32
-
33
-
34
-
35
-
36
-
37
-
38
-
39
-
40
-
41
-
42
-
43
-
44
-
45
-
46
-
47
-
48
-
49
-
50
-
51
-
52
-
53
-
54
-
55
-
56
-
57
-
58
-
59
-
60
-
61
-
62
-
63
-
64
-
65
-
66
-
67
-
68
-
69
-
70
-
71
-
72
-
73
-
74
-
75
-
76
-
77
-
78
-
79
-
80
-
81
-
82
-
83
-
84
-
85
-
86
-
87
-
88
-
 89
89 -
 90
90 -
 91
91 -
 92
92 -
 93
93 -
 94
94 -
 95
95 -
 96
96 -
 97
97 -
 98
98 -
 99
99 -
 100
100 -
 101
101 -
 102
102 -
 103
103 -
 104
104 -
 105
105 -
 106
106 -
 107
107 -
 108
108 -
 109
109 -
110
-
111
-
112
-
113
-
114
-
115
-
116
-
117
-
118
-
119
-
120
-
121
-
122
-
123
-
124
-
125
-
126
-
127
-
128
-
129
-
130
-
131
-
132
-
133
-
134
-
135
-
136
-
137
-
138
-
139
-
140
-
141
-
142
-
143
-
144
-
145
-
146
-
147
-
148
-
149
-
150
-
151
-
152
-
153
-
154
-
155
-
156
-
157
-
158
-
159
-
160
-
161
-
162
-
163
-
164
-
165
-
166
-
167
-
168
-
169
-
170
-
171
-
172
 |
 |

FORM 10-K
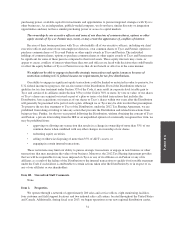
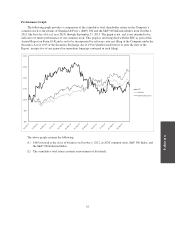
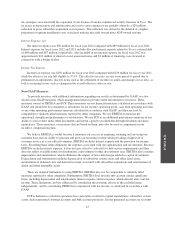
Performance Graph
The following graph provides a comparison of the cumulative total shareholder return on the Company’s
common stock to the returns of Standard & Poor’s (S&P) 500 and the S&P 500 Industrial Index from October 1,
2012 (the first day of fiscal year 2013) through September 27, 2013. The graph is not, and is not intended to be,
indicative of future performance of our common stock. This graph is not being filed with the SEC as part of this
Annual Report on Form 10-K and is not to be incorporated by reference into any filing of the Company under the
Securities Act of 1933 or the Securities Exchange Act of 1934 (whether made before or after the date of the
Report, irrespective of any general incorporation language contained in such filing).
$80
$90
$100
$110
$120
$130
$140
ADT
S&P 500
S&P 500 Industrials
The above graph assumes the following:
(1) $100 invested at the close of business on October 1, 2012, in ADT common stock, S&P 500 Index, and
the S&P 500 Industrial Index.
(2) The cumulative total return assumes reinvestment of dividends.
35