ADT 2013 Annual Report Download - page 101
Download and view the complete annual report
Please find page 101 of the 2013 ADT annual report below. You can navigate through the pages in the report by either clicking on the pages listed below, or by using the keyword search tool below to find specific information within the annual report.-
 1
1 -
2
-
3
-
4
-
5
-
6
-
7
-
8
-
9
-
10
-
11
-
12
-
13
-
14
-
15
-
16
-
17
-
18
-
19
-
20
-
21
-
22
-
23
-
24
-
25
-
26
-
27
-
28
-
29
-
30
-
31
-
32
-
33
-
34
-
35
-
36
-
37
-
38
-
39
-
40
-
41
-
42
-
43
-
44
-
45
-
46
-
47
-
48
-
49
-
50
-
51
-
52
-
53
-
54
-
55
-
56
-
57
-
58
-
59
-
60
-
61
-
62
-
63
-
64
-
65
-
66
-
67
-
68
-
69
-
70
-
71
-
72
-
73
-
74
-
75
-
76
-
77
-
78
-
79
-
80
-
81
-
82
-
83
-
84
-
85
-
86
-
87
-
88
-
89
-
90
-
 91
91 -
 92
92 -
 93
93 -
 94
94 -
 95
95 -
 96
96 -
 97
97 -
 98
98 -
 99
99 -
 100
100 -
 101
101 -
 102
102 -
 103
103 -
 104
104 -
 105
105 -
 106
106 -
 107
107 -
 108
108 -
 109
109 -
 110
110 -
 111
111 -
112
-
113
-
114
-
115
-
116
-
117
-
118
-
119
-
120
-
121
-
122
-
123
-
124
-
125
-
126
-
127
-
128
-
129
-
130
-
131
-
132
-
133
-
134
-
135
-
136
-
137
-
138
-
139
-
140
-
141
-
142
-
143
-
144
-
145
-
146
-
147
-
148
-
149
-
150
-
151
-
152
-
153
-
154
-
155
-
156
-
157
-
158
-
159
-
160
-
161
-
162
-
163
-
164
-
165
-
166
-
167
-
168
-
169
-
170
-
171
-
172
 |
 |

FORM 10-K
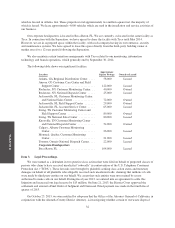
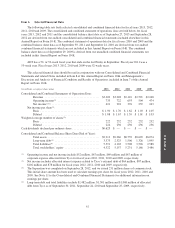
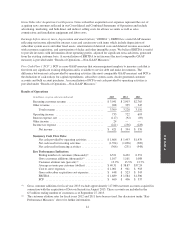
Item 6. Selected Financial Data.
The following table sets forth selected consolidated and combined financial data for fiscal years 2013, 2012,
2011, 2010 and 2009. The consolidated and combined statement of operations data set forth below for fiscal
years 2013, 2012 and 2011 and the consolidated balance sheet data as of September 27, 2013 and September 28,
2012 are derived from our audited consolidated and combined financial statements included elsewhere in this
Annual Report on Form 10-K. The combined statement of operations data for fiscal years 2010 and 2009 and the
combined balance sheet data as of September 30, 2011 and September 24, 2010 are derived from our audited
combined financial statements which are not included in this Annual Report on Form 10-K. The combined
balance sheet data as of September 29, 2009 is derived from our unaudited combined financial statements not
included in this Annual Report on Form 10-K.
ADT has a 52- or 53-week fiscal year that ends on the last Friday in September. Fiscal year 2011 was a
53-week year. Fiscal years 2013, 2012, 2010 and 2009 were 52-week years.
This selected financial data should be read in conjunction with our Consolidated and Combined Financial
Statements and related Notes included in Item 8 of this Annual Report on Form 10-K and Management’s
Discussion and Analysis of Financial Condition and Results of Operations, included in Item 7 of this Annual
Report on Form 10-K.
(in millions, except per share data) 2013 2012 2011 2010 2009
Consolidated and Combined Statements of Operations Data:
Revenue ...................................... $3,309 $3,228 $3,110 $2,591 $2,248
Operating income(1) ............................. 735 722 693 504 474
Net income(1)(2) ................................. 421 394 376 239 243
Net income per share(3):
Basic ......................................... $ 1.90 $ 1.70 $ 1.62 $ 1.03 $ 1.05
Diluted ....................................... $ 1.88 $ 1.67 $ 1.59 $ 1.01 $ 1.03
Weighted average number of shares(3):
Basic ......................................... 222 232 232 232 232
Diluted ....................................... 224 236 236 236 236
Cash dividends declared per ordinary share ................... $0.625 $ — $ — $ — $ —
Consolidated and Combined Balance Sheet Data (End of Year):
Total assets .................................... $9,913 $9,260 $8,739 $8,692 $6,074
Long-term debt(4) ............................... 3,373 2,525 1,506 1,326 1,095
Total liabilities(4) ............................... 5,591 4,103 3,508 3,526 2,588
Total stockholders’ equity ........................ 4,322 5,157 5,231 5,166 3,486
(1) Operating income and net income include $52 million, $67 million, $69 million and $67 million of
corporate expense allocated from Tyco for fiscal years 2012, 2011, 2010 and 2009, respectively.
(2) Net income includes allocated interest expense related to Tyco’s external debt of $64 million, $87 million,
$102 million and $78 million for fiscal years 2012, 2011, 2010 and 2009, respectively.
(3) The Separation was completed on September 28, 2012, and we issued 231 million shares of common stock.
This initial share amount has been used to calculate earnings per share for fiscal years 2012, 2011, 2010 and
2009. See Note 11 to the Consolidated and Combined Financial Statements for additional information on
earnings per share.
(4) Long-term debt and total liabilities include $1,482 million, $1,301 million and $1,068 million of allocated
debt from Tyco as of September 30, 2011, September 24, 2010 and September 25, 2009, respectively.
37