ADT 2013 Annual Report Download - page 155
Download and view the complete annual report
Please find page 155 of the 2013 ADT annual report below. You can navigate through the pages in the report by either clicking on the pages listed below, or by using the keyword search tool below to find specific information within the annual report.-
 1
1 -
2
-
3
-
4
-
5
-
6
-
7
-
8
-
9
-
10
-
11
-
12
-
13
-
14
-
15
-
16
-
17
-
18
-
19
-
20
-
21
-
22
-
23
-
24
-
25
-
26
-
27
-
28
-
29
-
30
-
31
-
32
-
33
-
34
-
35
-
36
-
37
-
38
-
39
-
40
-
41
-
42
-
43
-
44
-
45
-
46
-
47
-
48
-
49
-
50
-
51
-
52
-
53
-
54
-
55
-
56
-
57
-
58
-
59
-
60
-
61
-
62
-
63
-
64
-
65
-
66
-
67
-
68
-
69
-
70
-
71
-
72
-
73
-
74
-
75
-
76
-
77
-
78
-
79
-
80
-
81
-
82
-
83
-
84
-
85
-
86
-
87
-
88
-
89
-
90
-
91
-
92
-
93
-
94
-
95
-
96
-
97
-
98
-
99
-
100
-
101
-
102
-
103
-
104
-
105
-
106
-
107
-
108
-
109
-
110
-
111
-
112
-
113
-
114
-
115
-
116
-
117
-
118
-
119
-
120
-
121
-
122
-
123
-
124
-
125
-
126
-
127
-
128
-
129
-
130
-
131
-
132
-
133
-
134
-
135
-
136
-
137
-
138
-
139
-
140
-
141
-
142
-
143
-
144
-
 145
145 -
 146
146 -
 147
147 -
 148
148 -
 149
149 -
 150
150 -
 151
151 -
 152
152 -
 153
153 -
 154
154 -
 155
155 -
 156
156 -
 157
157 -
 158
158 -
 159
159 -
 160
160 -
 161
161 -
 162
162 -
 163
163 -
 164
164 -
 165
165 -
166
-
167
-
168
-
169
-
170
-
171
-
172
 |
 |

FORM 10-K
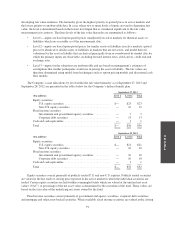
developing fair value estimates. The hierarchy gives the highest priority to quoted prices in active markets and
the lowest priority to unobservable data. In cases where two or more levels of inputs are used to determine fair
value, the level is determined based on the lowest level input that is considered significant to the fair value
measurement in its entirety. The three levels of the fair value hierarchy are summarized as follows:
• Level 1—inputs are based upon quoted prices (unadjusted) in active markets for identical assets or
liabilities which are accessible as of the measurement date.
• Level 2—inputs are based upon quoted prices for similar assets or liabilities in active markets, quoted
prices for identical or similar assets or liabilities in markets that are not active, and model derived
valuations for the asset or liability that are derived principally from or corroborated by market data for
which the primary inputs are observable, including forward interest rates, yield curves, credit risk and
exchange rates.
• Level 3—inputs for the valuations are unobservable and are based on management’s estimates of
assumptions that market participants would use in pricing the asset or liability. The fair values are
therefore determined using model based techniques such as option pricing models and discounted cash
flow models.
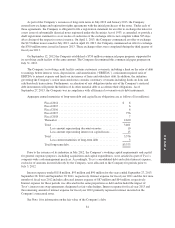
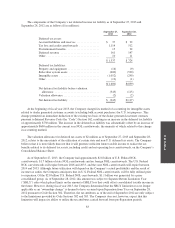
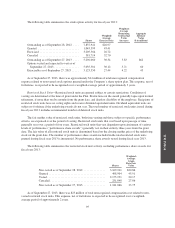
The Company’s asset allocations by level within the fair value hierarchy as of September 27, 2013 and
September 28, 2012 are presented in the tables below for the Company’s defined benefit plan.
September 27, 2013
($ in millions) Level 1 Level 2 Total
Equity securities:
U.S. equity securities ............................... $— $23 $23
Non-U.S. equity securities ........................... — 12 12
Fixed income securities:
Government and government agency securities .......... — 7 7
Corporate debt securities ............................ — 13 13
Cash and cash equivalents ............................... — 1 1
Total ................................................ $— $56 $56
September 28, 2012
($ in millions) Level 1 Level 2 Total
Equity securities:
U.S. equity securities ............................... $— $21 $21
Non-U.S. equity securities ........................... — 10 10
Fixed income securities:
Government and government agency securities .......... — 10 10
Corporate debt securities ............................ — 10 10
Cash and cash equivalents ............................... — 1 1
Total ................................................ $— $52 $52
Equity securities consist primarily of publicly traded U.S. and non-U.S. equities. Publicly traded securities
are valued at the last trade or closing price reported in the active market in which the individual securities are
traded. Certain equity securities are held within commingled funds which are valued at the unitized net asset
value (“NAV”) or percentage of the net asset value as determined by the custodian of the fund. These values are
based on the fair value of the underlying net assets owned by the fund.
Fixed income securities consist primarily of government and agency securities, corporate debt securities,
and mortgage and other asset-backed securities. When available, fixed income securities are valued at the closing
91