ADT 2013 Annual Report Download - page 40
Download and view the complete annual report
Please find page 40 of the 2013 ADT annual report below. You can navigate through the pages in the report by either clicking on the pages listed below, or by using the keyword search tool below to find specific information within the annual report.-
 1
1 -
2
-
3
-
4
-
5
-
6
-
7
-
8
-
9
-
10
-
11
-
12
-
13
-
14
-
15
-
16
-
17
-
18
-
19
-
20
-
21
-
22
-
23
-
24
-
25
-
26
-
27
-
28
-
29
-
 30
30 -
 31
31 -
 32
32 -
 33
33 -
 34
34 -
 35
35 -
 36
36 -
 37
37 -
 38
38 -
 39
39 -
 40
40 -
 41
41 -
 42
42 -
 43
43 -
 44
44 -
 45
45 -
 46
46 -
 47
47 -
 48
48 -
 49
49 -
 50
50 -
51
-
52
-
53
-
54
-
55
-
56
-
57
-
58
-
59
-
60
-
61
-
62
-
63
-
64
-
65
-
66
-
67
-
68
-
69
-
70
-
71
-
72
-
73
-
74
-
75
-
76
-
77
-
78
-
79
-
80
-
81
-
82
-
83
-
84
-
85
-
86
-
87
-
88
-
89
-
90
-
91
-
92
-
93
-
94
-
95
-
96
-
97
-
98
-
99
-
100
-
101
-
102
-
103
-
104
-
105
-
106
-
107
-
108
-
109
-
110
-
111
-
112
-
113
-
114
-
115
-
116
-
117
-
118
-
119
-
120
-
121
-
122
-
123
-
124
-
125
-
126
-
127
-
128
-
129
-
130
-
131
-
132
-
133
-
134
-
135
-
136
-
137
-
138
-
139
-
140
-
141
-
142
-
143
-
144
-
145
-
146
-
147
-
148
-
149
-
150
-
151
-
152
-
153
-
154
-
155
-
156
-
157
-
158
-
159
-
160
-
161
-
162
-
163
-
164
-
165
-
166
-
167
-
168
-
169
-
170
-
171
-
172
 |
 |

COMPENSATION OF EXECUTIVE OFFICERS—CONTINUED
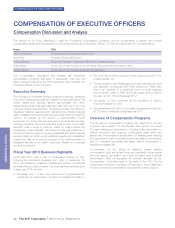
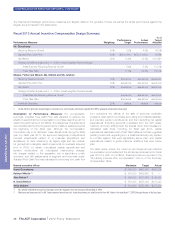
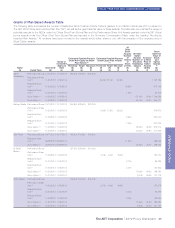
The financial and strategic performance measures and targets utilized in the guideline formula, as well as the actual performance against the
targets, are summarized in the table below.
Fiscal 2013 Annual Incentive Compensation Design Summary
Performance Measure Weighting Performance
Target Actual
Performance
% of
Target
Attained
Mr. Gursahaney
Recurring Revenue Growth 40% 5.2% 4.5% 86.5%
Adjusted Free Cash Flow 40% $544 million $520.3 million 95.6%
Net Attrition 20% 13.4% 13.9% 103.7%(1)
Strategic Modifier (adjustment of +/- 20% to overall weighted financial results)
Small Business Recurring Revenue Growth 5.2% 5.9% 113.5%
Pulse Take Rate 17.0% 25.5% 150.0%
Messrs. Ferber and Bleisch, Ms. Mikells and Ms. Graham
Recurring Revenue Growth 30% see above see above see above
Adjusted Free Cash Flow 30% see above see above see above
Net Attrition 20% see above see above see above
Strategic Modifier (adjustment of +/- 20% to overall weighted financial results)
Small Business Recurring Revenue Growth see above see above see above
Pulse Take Rate see above see above see above
Individual Objectives 20% various various various
(1) As Net Attrition represents the percentage of customers lost, net of resales, performance greater than 100% represents achievement below target
Description of Performance Measures: For compensation
purposes, Adjusted Free Cash Flow was adjusted to exclude the
effects of events that the Compensation Committee deems would not
reflect the performance of the NEOs. The categories of special items
were identified at the time the performance measure was approved at
the beginning of the fiscal year, although the Compensation
Committee may in its discretion make adjustments during the fiscal
year. For fiscal year 2013, the approved categories of adjustments
included adjustments related to (i) business acquisitions and
divestitures; (ii) debt refinancing; (iii) legacy legal and tax matters;
(iv) goodwill and intangible asset impairments for business acquired
prior to 2002; (v) certain unbudgeted capital expenditures and
pension contributions; (vi) unbudgeted restructuring charges;
(vii) charges related to the separation into a stand-alone public
company; and (viii) realignments of segment and corporate costs.
Adjusted Free Cash Flow was calculated by removing from cash flow
from operations the effects of the sale of accounts receivable
programs, cash paid for purchase accounting and holdback liabilities,
and voluntary pension contributions, and then deducting net capital
expenditures (including accounts purchased from the ADT dealer
network), and then adding back the special items that increased or
decreased cash flows, including, for fiscal year 2013, capital
expenditures associated with Pulse Take Rates and Pulse upgrades
(existing customers upgrading from a traditional security-only system
to a Pulse system) that were significantly above plan, and capital
expenditures related to gross customer additions that were below
plan.
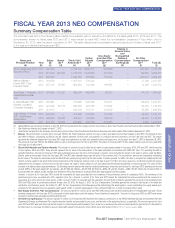
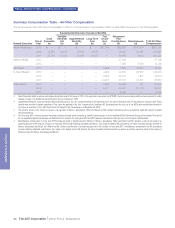
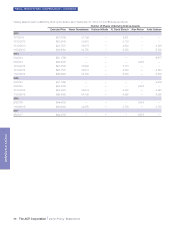
The table below shows the maximum and target annual incentive
compensation opportunities and the actual payments earned for fiscal
year 2013 for each of our NEOs. These amounts are reported in the
“Non-Equity Incentive Plan Compensation” column of the Summary
Compensation Table.
Named executive officer Maximum Target Actual
Naren Gursahaney $1,800,000 $900,000 $693,000
Kathryn Mikells (1) $ 979,200 $489,600 $ —
Alan Ferber (2) $ 540,000 $270,000 $ 90,383
N. David Bleisch $ 510,000 $255,000 $191,221
Anita Graham $ 504,000 $252,000 $187,439
(1) Ms. Mikells forfeited her annual incentive award upon her resignation from the Company effective May 2, 2013.
(2) Maximum and target amounts for Mr. Ferber represent annual amounts. Actual amount was pro-rated for period from Mr. Ferber’s hire date (April 17, 2013) through the end of the fiscal year.
28 The ADT Corporation 2014 Proxy Statement
PROXY STATEMENT