ADT 2013 Annual Report Download - page 113
Download and view the complete annual report
Please find page 113 of the 2013 ADT annual report below. You can navigate through the pages in the report by either clicking on the pages listed below, or by using the keyword search tool below to find specific information within the annual report.-
 1
1 -
2
-
3
-
4
-
5
-
6
-
7
-
8
-
9
-
10
-
11
-
12
-
13
-
14
-
15
-
16
-
17
-
18
-
19
-
20
-
21
-
22
-
23
-
24
-
25
-
26
-
27
-
28
-
29
-
30
-
31
-
32
-
33
-
34
-
35
-
36
-
37
-
38
-
39
-
40
-
41
-
42
-
43
-
44
-
45
-
46
-
47
-
48
-
49
-
50
-
51
-
52
-
53
-
54
-
55
-
56
-
57
-
58
-
59
-
60
-
61
-
62
-
63
-
64
-
65
-
66
-
67
-
68
-
69
-
70
-
71
-
72
-
73
-
74
-
75
-
76
-
77
-
78
-
79
-
80
-
81
-
82
-
83
-
84
-
85
-
86
-
87
-
88
-
89
-
90
-
91
-
92
-
93
-
94
-
95
-
96
-
97
-
98
-
99
-
100
-
101
-
102
-
 103
103 -
 104
104 -
 105
105 -
 106
106 -
 107
107 -
 108
108 -
 109
109 -
 110
110 -
 111
111 -
 112
112 -
 113
113 -
 114
114 -
 115
115 -
 116
116 -
 117
117 -
 118
118 -
 119
119 -
 120
120 -
 121
121 -
 122
122 -
 123
123 -
124
-
125
-
126
-
127
-
128
-
129
-
130
-
131
-
132
-
133
-
134
-
135
-
136
-
137
-
138
-
139
-
140
-
141
-
142
-
143
-
144
-
145
-
146
-
147
-
148
-
149
-
150
-
151
-
152
-
153
-
154
-
155
-
156
-
157
-
158
-
159
-
160
-
161
-
162
-
163
-
164
-
165
-
166
-
167
-
168
-
169
-
170
-
171
-
172
 |
 |

FORM 10-K
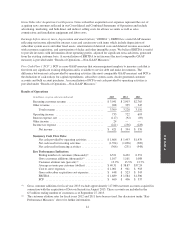
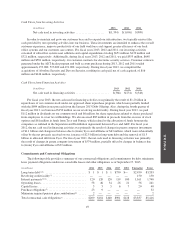
Cash Flows from Investing Activities
(in millions) 2013 2012 2011
Net cash used in investing activities .................... $(1,394) $(1,096) $(909)
In order to maintain and grow our customer base and to expand our infrastructure, we typically reinvest the
cash provided by our operating activities into our business. These investments are intended to enhance the overall
customer experience, improve productivity of our field workforce and support greater efficiency of our back
office systems and our customer care centers. For fiscal years 2013, 2012 and 2011, our investing activities
consisted of subscriber system asset additions and capital expenditures totaling $651 million, $439 million and
$321 million, respectively. Additionally, during fiscal years 2013, 2012 and 2011, we paid $555 million, $648
million and $581 million, respectively, for customer contracts for electronic security services. Customer contracts
generated under the ADT dealer program and bulk account purchases during 2013, 2012 and 2011 totaled
approximately 453,000, 527,000 and 491,000, respectively. During fiscal year 2013, we completed the
acquisitions of Absolute Security and Devcon Security, resulting in cash paid, net of cash acquired, of $16
million and $146 million, respectively.
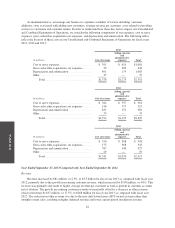
Cash Flows from Financing Activities
(in millions) 2013 2012 2011
Net cash used in financing activities ....................... $(366) $(231) $(548)
For fiscal year 2013, the net cash used in financing activities was primarily the result of $1.2 billion in
repurchases of our common stock under our approved share repurchase program, which were partially funded
with the $694 million in net proceeds from the January 2013 Debt Offering. Also, during the fourth quarter of
fiscal year 2013, we borrowed $150 million on our revolving credit facility. During fiscal year 2013, we paid
$112 million in dividends on our common stock and $6 million for share repurchases related to shares purchased
from employees to cover tax withholdings. We also received $85 million in proceeds from the exercise of stock
options and $61 million in funds from Tyco and Pentair, which related to the allocation of funds between the
companies as outlined in the Separation and Distribution Agreement between Tyco and ADT. For fiscal year
2012, the net cash used in financing activities was primarily the result of changes in parent company investment
of $1.1 billion and changes in balances due to (from) Tyco and affiliates of $63 million, which were substantially
offset by the net proceeds received on our issuance of $2.5 billion in long-term debt and the removal of $1.5
billion in allocated debt from Tyco. For fiscal year 2011, the net cash used in financing activities was primarily
the result of changes in parent company investment of $574 million, partially offset by changes in balances due
to (from) Tyco and affiliates of $32 million.
Commitments and Contractual Obligations
The following table provides a summary of our contractual obligations and commitments for debt, minimum
lease payment obligations under non-cancelable leases and other obligations as of September 27, 2013.
(in millions) 2014 2015 2016 2017 2018 Thereafter Total
Long-term debt(1)(4) ............................$1$1$1$750 $— $2,450 $3,203
Revolving credit facility(2) ....................... — — — — — 150 150
Interest payments(3)(4) ........................... 120 120 120 119 100 1,161 1,740
Operating leases ............................... 58 46 34 26 21 56 241
Capital leases .................................55567 20 48
Purchase obligations(5) .......................... 23 9 — — — — 32
Minimum required pension plan contributions(6) ..... 2 ———— — 2
Total contractual cash obligations(7) ............... $209 $181 $160 $901 $128 $3,837 $5,416
49