ADT 2013 Annual Report Download - page 107
Download and view the complete annual report
Please find page 107 of the 2013 ADT annual report below. You can navigate through the pages in the report by either clicking on the pages listed below, or by using the keyword search tool below to find specific information within the annual report.-
 1
1 -
2
-
3
-
4
-
5
-
6
-
7
-
8
-
9
-
10
-
11
-
12
-
13
-
14
-
15
-
16
-
17
-
18
-
19
-
20
-
21
-
22
-
23
-
24
-
25
-
26
-
27
-
28
-
29
-
30
-
31
-
32
-
33
-
34
-
35
-
36
-
37
-
38
-
39
-
40
-
41
-
42
-
43
-
44
-
45
-
46
-
47
-
48
-
49
-
50
-
51
-
52
-
53
-
54
-
55
-
56
-
57
-
58
-
59
-
60
-
61
-
62
-
63
-
64
-
65
-
66
-
67
-
68
-
69
-
70
-
71
-
72
-
73
-
74
-
75
-
76
-
77
-
78
-
79
-
80
-
81
-
82
-
83
-
84
-
85
-
86
-
87
-
88
-
89
-
90
-
91
-
92
-
93
-
94
-
95
-
96
-
 97
97 -
 98
98 -
 99
99 -
 100
100 -
 101
101 -
 102
102 -
 103
103 -
 104
104 -
 105
105 -
 106
106 -
 107
107 -
 108
108 -
 109
109 -
 110
110 -
 111
111 -
 112
112 -
 113
113 -
 114
114 -
 115
115 -
 116
116 -
 117
117 -
118
-
119
-
120
-
121
-
122
-
123
-
124
-
125
-
126
-
127
-
128
-
129
-
130
-
131
-
132
-
133
-
134
-
135
-
136
-
137
-
138
-
139
-
140
-
141
-
142
-
143
-
144
-
145
-
146
-
147
-
148
-
149
-
150
-
151
-
152
-
153
-
154
-
155
-
156
-
157
-
158
-
159
-
160
-
161
-
162
-
163
-
164
-
165
-
166
-
167
-
168
-
169
-
170
-
171
-
172
 |
 |

FORM 10-K
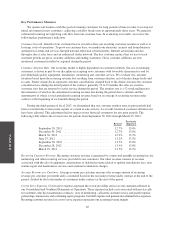
Average revenue per customer increased by $1.44, or 3.7%, as of September 27, 2013 compared with
September 28, 2012 primarily due to price escalations on our existing customer base and the addition of new
customers at higher rates, including increased take rates on ADT Pulse.
Gross customer additions were approximately 1.1 million during fiscal year 2013, reflecting customer
account growth of 654,000 in the direct channel and 453,000 in the dealer channel. Additionally, we acquired
approximately 117,000 customer accounts in conjunction with our acquisition of Devcon Security, which was
completed in August 2013. Excluding these accounts, gross customer additions fell by 54,000, or 4.7%, during
fiscal year 2013 as compared to fiscal year 2012, as increases in additions from our direct channel were not
sufficient to offset lower dealer channel production. Net of attrition, our ending number of customers grew by
99,000, or 1.5%, during fiscal year 2013. Our annualized customer attrition as of September 27, 2013 was 13.9%
compared with 13.5% as of September 28, 2012. The increase in customer attrition from September 28, 2012 was
due primarily to relocation disconnects as a result of the continued recovery of the housing market. We continue
to focus on high quality service and our disciplined customer selection process in order to limit customer
attrition.
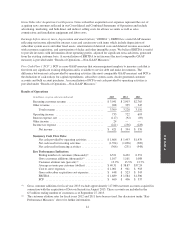
Operating Income
Operating income increased by $13 million, or 1.8%, to $735 million for fiscal year 2013 as compared with
fiscal year 2012. Operating margin was 22.2% for fiscal year 2013 compared with 22.4% for fiscal 2012.
Operating expenses for fiscal year 2013, which included $23 million of costs related to the Separation, totaled
$2.6 billion, up 2.7% or $68 million as compared to fiscal year 2012. The increase in operating expenses includes
$83 million in higher depreciation and amortization expense related primarily to our subscriber system assets and
dealer generated accounts. Cost to serve expenses totaled $1.0 billion for fiscal year 2013 as compared to $961
million for fiscal year 2012. Cost to serve expenses for fiscal year 2012 include integration costs related to the
acquisition of Broadview Security of $14 million and restructuring related expenses of approximately $4 million.
After considering these items, cost to serve expenses increased by approximately $58 million for fiscal year 2013
as compared to fiscal year 2012. This increase was primarily a result of higher corporate costs and dis-synergies
associated with the separation of our business from the commercial security business of Tyco and increased
customer service and maintenance expenses driven by investments to improve customer retention. The increase
was partially offset by a reduction in legal-related charges as certain costs incurred in fiscal year 2012 did not
recur in fiscal year 2013. The increases in depreciation and amortization and cost to serve expenses were partially
offset by a $75 million reduction in gross subscriber acquisition cost expenses, which resulted from the deferral
of a higher proportion of upfront installation costs associated with the mix shift toward more ADT-owned
systems.
AT&T and certain other telecommunication providers have advised us that they will discontinue their 2G
services in the future. In connection with these plans, we have initiated a three-year program associated with the
replacement of 2G radios used in many of our security systems, which will result in incremental costs beginning
in fiscal year 2014. Additionally, during fiscal year 2014, we expect to incur incremental costs associated with
the integration of acquisitions as well as costs to realize efficiencies. We will also continue to incur costs directly
associated with the Separation during fiscal year 2014. In total, we anticipate that we will incur between $50
million and $65 million in fiscal year 2014 in conjunction with these activities, of which approximately half is
associated with the 2G conversion program.
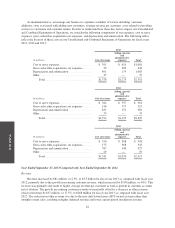
Interest Expense, net
Net interest expense was $117 million for fiscal year 2013 compared with $92 million for fiscal year 2012.
Interest expense for fiscal year 2013 is comprised primarily of interest on our long-term debt, which reflects an
increase in borrowings related to the issuance of $700 million in notes during January 2013. Interest expense for
fiscal year 2012 includes $64 million of allocated interest expense related to Tyco’s external debt, approximately
$22 million of interest on our unsecured notes and $3 million of financing costs incurred in connection with a
bridge facility.
43