ADT 2013 Annual Report Download - page 135
Download and view the complete annual report
Please find page 135 of the 2013 ADT annual report below. You can navigate through the pages in the report by either clicking on the pages listed below, or by using the keyword search tool below to find specific information within the annual report.-
 1
1 -
2
-
3
-
4
-
5
-
6
-
7
-
8
-
9
-
10
-
11
-
12
-
13
-
14
-
15
-
16
-
17
-
18
-
19
-
20
-
21
-
22
-
23
-
24
-
25
-
26
-
27
-
28
-
29
-
30
-
31
-
32
-
33
-
34
-
35
-
36
-
37
-
38
-
39
-
40
-
41
-
42
-
43
-
44
-
45
-
46
-
47
-
48
-
49
-
50
-
51
-
52
-
53
-
54
-
55
-
56
-
57
-
58
-
59
-
60
-
61
-
62
-
63
-
64
-
65
-
66
-
67
-
68
-
69
-
70
-
71
-
72
-
73
-
74
-
75
-
76
-
77
-
78
-
79
-
80
-
81
-
82
-
83
-
84
-
85
-
86
-
87
-
88
-
89
-
90
-
91
-
92
-
93
-
94
-
95
-
96
-
97
-
98
-
99
-
100
-
101
-
102
-
103
-
104
-
105
-
106
-
107
-
108
-
109
-
110
-
111
-
112
-
113
-
114
-
115
-
116
-
117
-
118
-
119
-
120
-
121
-
122
-
123
-
124
-
 125
125 -
 126
126 -
 127
127 -
 128
128 -
 129
129 -
 130
130 -
 131
131 -
 132
132 -
 133
133 -
 134
134 -
 135
135 -
 136
136 -
 137
137 -
 138
138 -
 139
139 -
 140
140 -
 141
141 -
 142
142 -
 143
143 -
 144
144 -
 145
145 -
146
-
147
-
148
-
149
-
150
-
151
-
152
-
153
-
154
-
155
-
156
-
157
-
158
-
159
-
160
-
161
-
162
-
163
-
164
-
165
-
166
-
167
-
168
-
169
-
170
-
171
-
172
 |
 |

FORM 10-K
The Company records estimated product warranty costs at the time of sale. The carrying amounts of the
Company’s warranty accrual as of September 27, 2013 and September 28, 2012 were not material.
Advertising—Advertising costs which amounted to $163 million, $155 million and $152 million for fiscal
years 2013, 2012 and 2011, respectively, are expensed when incurred and are included in selling, general and
administrative expenses.
Acquisition Costs—Acquisition costs are expensed when incurred and are included in selling, general and
administrative expenses. See Note 2.
Separation Costs—During fiscal year 2013, the Company incurred charges directly related to the Separation
of $23 million. These costs are reflected in separation costs in the Consolidated and Combined Statement of
Operations. During fiscal year 2012, the Company incurred approximately $10 million in separation related
charges, of which $7 million is included in separation costs and $3 million is included in interest expense on the
Consolidated and Combined Statement of Operations.
Other Income—During fiscal year 2013, the Company recorded $24 million of other income, which is
comprised primarily of $23 million of non-taxable income recorded pursuant to the tax sharing agreement
entered into in conjunction with the Separation. See Note 6 for further information.
Translation of Foreign Currency—The Company’s Consolidated and Combined Financial Statements are
reported in U.S. dollars. A portion of the Company’s business is transacted in Canadian dollars. The Company’s
Canadian entity maintains its records in Canadian dollars. The assets and liabilities are translated into U.S.
dollars using rates of exchange at the balance sheet date and translation adjustments are recorded in accumulated
other comprehensive income. Revenue and expenses are translated at average rates of exchange in effect during
the year.
Cash and Cash Equivalents—All highly liquid investments with original maturities of three months or less
from the time of purchase are considered to be cash equivalents.
Allowance for Doubtful Accounts—The allowance for doubtful accounts receivable reflects the best estimate
of probable losses inherent in the Company’s receivable portfolio determined on the basis of historical
experience and other currently available evidence.
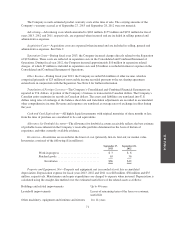
Inventories—Inventories are recorded at the lower of cost (primarily first-in, first-out) or market value.
Inventories consisted of the following ($ in millions):
September 27,
2013
September 28,
2012
Work in progress ........................... $ 3 $ 6
Finished goods ............................. 63 36
Inventories ............................ $66 $42
Property and Equipment, Net—Property and equipment, net is recorded at cost less accumulated
depreciation. Depreciation expense for fiscal years 2013, 2012 and 2011 was $48 million, $38 million and $35
million, respectively. Maintenance and repair expenditures are charged to expense when incurred. Depreciation is
calculated using the straight-line method over the estimated useful lives of the related assets as follows:
Buildings and related improvements Up to 40 years
Leasehold improvements Lesser of remaining term of the lease or economic
useful life
Other machinery, equipment and furniture and fixtures 1 to 14 years
71