ADT 2013 Annual Report Download - page 109
Download and view the complete annual report
Please find page 109 of the 2013 ADT annual report below. You can navigate through the pages in the report by either clicking on the pages listed below, or by using the keyword search tool below to find specific information within the annual report.-
 1
1 -
2
-
3
-
4
-
5
-
6
-
7
-
8
-
9
-
10
-
11
-
12
-
13
-
14
-
15
-
16
-
17
-
18
-
19
-
20
-
21
-
22
-
23
-
24
-
25
-
26
-
27
-
28
-
29
-
30
-
31
-
32
-
33
-
34
-
35
-
36
-
37
-
38
-
39
-
40
-
41
-
42
-
43
-
44
-
45
-
46
-
47
-
48
-
49
-
50
-
51
-
52
-
53
-
54
-
55
-
56
-
57
-
58
-
59
-
60
-
61
-
62
-
63
-
64
-
65
-
66
-
67
-
68
-
69
-
70
-
71
-
72
-
73
-
74
-
75
-
76
-
77
-
78
-
79
-
80
-
81
-
82
-
83
-
84
-
85
-
86
-
87
-
88
-
89
-
90
-
91
-
92
-
93
-
94
-
95
-
96
-
97
-
98
-
 99
99 -
 100
100 -
 101
101 -
 102
102 -
 103
103 -
 104
104 -
 105
105 -
 106
106 -
 107
107 -
 108
108 -
 109
109 -
 110
110 -
 111
111 -
 112
112 -
 113
113 -
 114
114 -
 115
115 -
 116
116 -
 117
117 -
 118
118 -
 119
119 -
120
-
121
-
122
-
123
-
124
-
125
-
126
-
127
-
128
-
129
-
130
-
131
-
132
-
133
-
134
-
135
-
136
-
137
-
138
-
139
-
140
-
141
-
142
-
143
-
144
-
145
-
146
-
147
-
148
-
149
-
150
-
151
-
152
-
153
-
154
-
155
-
156
-
157
-
158
-
159
-
160
-
161
-
162
-
163
-
164
-
165
-
166
-
167
-
168
-
169
-
170
-
171
-
172
 |
 |

FORM 10-K
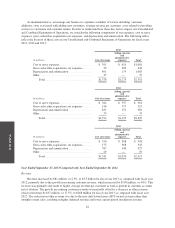
dis-synergies associated with the separation of our business from the commercial security business of Tyco. The
increases in depreciation and amortization and cost to serve expenses were partially offset by a $20 million
reduction in gross subscriber acquisition cost expenses. This reduction was driven by the deferral of a higher
proportion of upfront installation costs associated with the mix shift toward more ADT-owned systems.
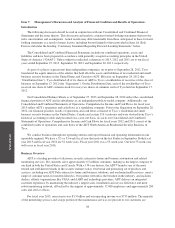
Interest Expense, net
Net interest expense was $92 million for fiscal year 2012 compared with $89 million for fiscal year 2011.
Interest expense for fiscal years 2012 and 2011 include allocated interest expense related to Tyco’s external debt
of $64 million and $87 million, respectively. Also included in net interest expense for fiscal year 2012 was
approximately $22 million of interest on our unsecured notes and $3 million of financing costs incurred in
connection with a bridge facility.
Income Tax Expense
Income tax expense was $236 million for fiscal year 2012 compared with $228 million for fiscal year 2011,
while the effective tax rate fell slightly to 37.5%. The effective tax rate can vary from period to period due to
permanent tax adjustments, discrete items such as the settlement of income tax audits and changes in tax laws, as
well as recurring factors such as changes in the overall effective state tax rate.
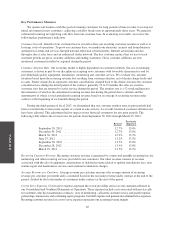
Non-GAAP Measures
To provide investors with additional information regarding our results as determined by GAAP, we also
disclose non-GAAP measures which management believes provide useful information to investors. These
measures consist of EBITDA and FCF. These measures are not financial measures calculated in accordance with
GAAP and should not be considered as substitutes for net income, operating profit, cash from operating activities
or any other operating performance measure calculated in accordance with GAAP, and they may not be
comparable to similarly titled measures reported by other companies. We use EBITDA to measure the
operational strength and performance of our business. We use FCF as an additional performance measure of our
ability to service debt, make other investments and return capital to stockholders through dividends and share
repurchases. These measures, or measures that are based on them, may also be used as components in our
incentive compensation plans.
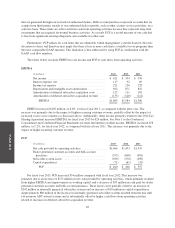
We believe EBITDA is useful because it measures our success in acquiring, retaining and servicing our
customer base and our ability to generate and grow our recurring revenue while providing a high level of
customer service in a cost-effective manner. EBITDA excludes interest expense and the provision for income
taxes. Excluding these items eliminates the expenses associated with our capitalization and tax structure. Because
EBITDA excludes interest expense, it does not give effect to cash used for debt service requirements and thus
does not reflect available funds for distributions, reinvestment or other discretionary uses. EBITDA also excludes
depreciation and amortization, which eliminates the impact of non-cash charges related to capital investments.
Depreciation and amortization includes depreciation of subscriber system assets and other fixed assets,
amortization of deferred costs and deferred revenue associated with subscriber acquisitions and amortization of
dealer and other intangible assets.
There are material limitations to using EBITDA. EBITDA may not be comparable to similarly titled
measures reported by other companies. Furthermore, EBITDA does not take into account certain significant
items, including depreciation and amortization, interest expense and tax expense, which directly affect our net
income. These limitations are best addressed by considering the economic effects of the excluded items
independently, and by considering EBITDA in conjunction with net income as calculated in accordance with
GAAP.
FCF is defined as cash from operations less cash outlays related to capital expenditures, subscriber system
assets, dealer generated customer accounts and bulk account purchases. Dealer generated accounts are accounts
45