ADT 2013 Annual Report Download - page 108
Download and view the complete annual report
Please find page 108 of the 2013 ADT annual report below. You can navigate through the pages in the report by either clicking on the pages listed below, or by using the keyword search tool below to find specific information within the annual report.-
 1
1 -
2
-
3
-
4
-
5
-
6
-
7
-
8
-
9
-
10
-
11
-
12
-
13
-
14
-
15
-
16
-
17
-
18
-
19
-
20
-
21
-
22
-
23
-
24
-
25
-
26
-
27
-
28
-
29
-
30
-
31
-
32
-
33
-
34
-
35
-
36
-
37
-
38
-
39
-
40
-
41
-
42
-
43
-
44
-
45
-
46
-
47
-
48
-
49
-
50
-
51
-
52
-
53
-
54
-
55
-
56
-
57
-
58
-
59
-
60
-
61
-
62
-
63
-
64
-
65
-
66
-
67
-
68
-
69
-
70
-
71
-
72
-
73
-
74
-
75
-
76
-
77
-
78
-
79
-
80
-
81
-
82
-
83
-
84
-
85
-
86
-
87
-
88
-
89
-
90
-
91
-
92
-
93
-
94
-
95
-
96
-
97
-
 98
98 -
 99
99 -
 100
100 -
 101
101 -
 102
102 -
 103
103 -
 104
104 -
 105
105 -
 106
106 -
 107
107 -
 108
108 -
 109
109 -
 110
110 -
 111
111 -
 112
112 -
 113
113 -
 114
114 -
 115
115 -
 116
116 -
 117
117 -
 118
118 -
119
-
120
-
121
-
122
-
123
-
124
-
125
-
126
-
127
-
128
-
129
-
130
-
131
-
132
-
133
-
134
-
135
-
136
-
137
-
138
-
139
-
140
-
141
-
142
-
143
-
144
-
145
-
146
-
147
-
148
-
149
-
150
-
151
-
152
-
153
-
154
-
155
-
156
-
157
-
158
-
159
-
160
-
161
-
162
-
163
-
164
-
165
-
166
-
167
-
168
-
169
-
170
-
171
-
172
 |
 |

FORM 10-K
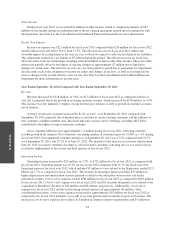
Other Income
During fiscal year 2013, we recorded $24 million of other income, which is comprised primarily of $23
million of non-taxable income recorded pursuant to the tax sharing agreement entered into in conjunction with
the Separation. See Note 6 to the Consolidated and Combined Financial Statements for more information.
Income Tax Expense
Income tax expense was $221 million for fiscal year 2013 compared with $236 million for fiscal year 2012,
and the effective tax rate fell to 34.4% from 37.5%. The effective tax rate for fiscal year 2013 reflects the
favorable impact of an adjustment to the state tax rate at which we expect to settle our net deferred tax liabilities.
This adjustment resulted in a tax benefit of $7 million during the period. The effective tax rate for fiscal year
2013 also reflects the favorable impact resulting from $23 million in non-taxable other income. These favorable
items were partially offset by the impact of discrete charges of approximately $7 million due to legislative
changes in certain states. The effective tax rate can vary from period to period due to permanent tax adjustments,
discrete items such as the settlement of income tax audits and changes in tax laws, as well as recurring factors
such as changes in the overall effective state tax rate. See Note 6 to the Consolidated and Combined Financial
Statements for more information on income taxes.
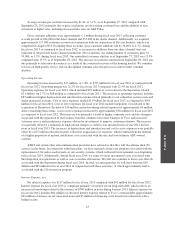
Year Ended September 28, 2012 Compared with Year Ended September 30, 2011
Revenue
Revenue increased by $118 million, or 3.8%, to $3.2 billion for fiscal year 2012 as compared with fiscal
year 2011, primarily due to the growth in recurring customer revenue, which increased by $138 million, or 5.0%.
This increase was due primarily to higher average revenue per customer as well as growth in customer accounts,
net of attrition.
Average revenue per customer increased by $1.63, or 4.4%, as of September 28, 2012 compared with
September 30, 2011 primarily due to planned price escalations to certain existing customers and the addition of
new customers at higher monthly rates. Increased take rates on new service offerings, including ADT Pulse,
contributed to the higher average revenue per customer.
Gross customer additions were approximately 1.2 million during fiscal year 2012, reflecting customer
account growth in all channels. Net of attrition, our ending number of customers grew by 71,000, or 1.1%, during
fiscal year 2012. Our annualized customer attrition as of September 28, 2012 was 13.5% compared with 12.7%
as of September 30, 2011 and 13.2% as of June 29, 2012. The majority of the increase in customer attrition from
June 29, 2012 was due to voluntary disconnects, which includes customers canceling service as a result of price
escalations implemented in the second and third quarters of fiscal year 2012.
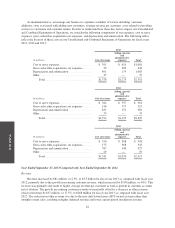
Operating Income
Operating income increased by $29 million, or 4.2%, to $722 million for fiscal year 2012 as compared with
fiscal year 2011. Operating margin was 22.4% for fiscal year 2012 compared with 22.3% for fiscal year 2011.
Operating expenses for fiscal year 2012, which included $7 million of costs related to the Separation, totaled $2.5
billion, up 3.7% as compared to fiscal year 2011. The increase in operating expenses includes $55 million in
higher depreciation and amortization expense primarily related to our subscriber system assets and dealer
generated accounts. Cost to serve expenses totaled $961 million for fiscal year 2012 as compared to $918 million
for fiscal year 2011. Cost to serve expenses for fiscal years 2012 and 2011 include integration costs related to the
acquisition of Broadview Security of $14 million and $28 million, respectively. Additionally, cost to serve
expenses for fiscal year 2012 include restructuring related expenses of approximately $4 million. After
considering these items, cost to serve expenses increased by approximately $53 million for fiscal year 2012 as
compared to fiscal year 2011 primarily as a result of account growth and investments to grow our business. The
increase in cost to serve expenses also reflects $15 million in charges related to legal matters and $5 million in
44