ADT 2013 Annual Report Download - page 104
Download and view the complete annual report
Please find page 104 of the 2013 ADT annual report below. You can navigate through the pages in the report by either clicking on the pages listed below, or by using the keyword search tool below to find specific information within the annual report.-
 1
1 -
2
-
3
-
4
-
5
-
6
-
7
-
8
-
9
-
10
-
11
-
12
-
13
-
14
-
15
-
16
-
17
-
18
-
19
-
20
-
21
-
22
-
23
-
24
-
25
-
26
-
27
-
28
-
29
-
30
-
31
-
32
-
33
-
34
-
35
-
36
-
37
-
38
-
39
-
40
-
41
-
42
-
43
-
44
-
45
-
46
-
47
-
48
-
49
-
50
-
51
-
52
-
53
-
54
-
55
-
56
-
57
-
58
-
59
-
60
-
61
-
62
-
63
-
64
-
65
-
66
-
67
-
68
-
69
-
70
-
71
-
72
-
73
-
74
-
75
-
76
-
77
-
78
-
79
-
80
-
81
-
82
-
83
-
84
-
85
-
86
-
87
-
88
-
89
-
90
-
91
-
92
-
93
-
 94
94 -
 95
95 -
 96
96 -
 97
97 -
 98
98 -
 99
99 -
 100
100 -
 101
101 -
 102
102 -
 103
103 -
 104
104 -
 105
105 -
 106
106 -
 107
107 -
 108
108 -
 109
109 -
 110
110 -
 111
111 -
 112
112 -
 113
113 -
 114
114 -
115
-
116
-
117
-
118
-
119
-
120
-
121
-
122
-
123
-
124
-
125
-
126
-
127
-
128
-
129
-
130
-
131
-
132
-
133
-
134
-
135
-
136
-
137
-
138
-
139
-
140
-
141
-
142
-
143
-
144
-
145
-
146
-
147
-
148
-
149
-
150
-
151
-
152
-
153
-
154
-
155
-
156
-
157
-
158
-
159
-
160
-
161
-
162
-
163
-
164
-
165
-
166
-
167
-
168
-
169
-
170
-
171
-
172
 |
 |

FORM 10-K
Key Performance Measures
We operate our business with the goal of retaining customers for long periods of time in order to recoup our
initial investment in new customers, achieving cash flow break-even in approximately three years. We generate
substantial recurring net operating cash flow from our customer base. In evaluating our results, we review the
following key performance indicators:
Customer Growth. Growth of our customer base is crucial to drive our recurring customer revenue as well as to
leverage costs of operations. To grow our customer base, we market our electronic security and home/business
automation systems and services through national television advertisements, Internet advertising and also
through a direct sales force and an authorized dealer network. The key customer metrics that we use to track
customer growth are gross customer additions and ending customers. Gross customer additions are new
monitored customers installed or acquired during the period.
Customer Attrition Rate. Our economic model is highly dependent on customer retention. Success in retaining
customers is driven in part by our discipline in accepting new customers with favorable characteristics and by
providing high quality equipment, installation, monitoring and customer service. We evaluate our customer
retention based upon the recurring revenue lost resulting from customer attrition, net of dealer charge-backs and
re-sales. Dealer charge-backs represent customer cancellations charged back to the dealers because the customer
canceled service during the initial period of the contract, generally 12 to 15 months. Re-sales are inactive
customer sites that are returned to active service during the period. The attrition rate is a 52-week trailing ratio,
the numerator of which is the annualized recurring revenue lost during the period due to attrition and the
denominator of which is total annualized recurring revenue based on an average of recurring revenue under
contract at the beginning of each month during the period.
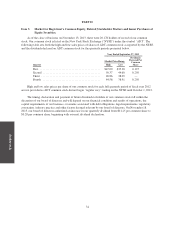
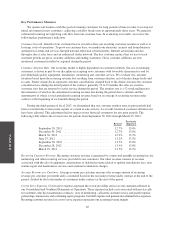
During the third quarter of fiscal 2013, we determined that our customer attrition rates in prior periods had
been overstated due to inaccurate capture of certain re-sale activity. As a result, historical customer attrition rates
have been adjusted. This adjustment had no impact on our financial statements for any prior periods. The
following table reflects the revised rates for periods from September 30, 2011 through March 29, 2013:
Revised
Previously
Reported
September 30, 2011 ................................ 12.7% 13.0%
December 30, 2011 ................................ 12.7% 13.0%
March 30, 2012 ................................... 12.9% 13.2%
June 29, 2012 ..................................... 13.2% 13.5%
September 28, 2012 ................................ 13.5% 13.8%
December 28, 2012 ................................ 13.4% 13.8%
March 29, 2013 ................................... 13.5% 13.9%
Recurring Customer Revenue. Recurring customer revenue is generated by contractual monthly recurring fees for
monitoring and other recurring services provided to our customers. Our other revenue consists of revenue
associated with the sale of equipment, amortization of deferred revenue related to upfront installations fees, non-
routine repair and maintenance services and customer termination charges.
Average Revenue per Customer. Average revenue per customer measures the average amount of recurring
revenue per customer per month and is calculated based on the recurring revenue under contract at the end of the
period, divided by the total number of customers under contract at the end of the period.
Cost to Serve Expenses. Cost to serve expenses represent the cost of providing services to our customers reflected in
our Consolidated and Combined Statements of Operations. These expenses include costs associated with service calls
for customers who have maintenance contracts, costs of monitoring, call center customer service and guard response,
partnership commissions and continuing equity programs, bad debt expense and general and administrative expenses.
Recurring customer revenue less cost to serve expenses represents our recurring revenue margin.
40