ADT 2013 Annual Report Download - page 6
Download and view the complete annual report
Please find page 6 of the 2013 ADT annual report below. You can navigate through the pages in the report by either clicking on the pages listed below, or by using the keyword search tool below to find specific information within the annual report.-
 1
1 -
 2
2 -
 3
3 -
 4
4 -
 5
5 -
 6
6 -
 7
7 -
 8
8 -
 9
9 -
 10
10 -
 11
11 -
 12
12 -
 13
13 -
 14
14 -
 15
15 -
 16
16 -
 17
17 -
18
-
19
-
20
-
21
-
22
-
23
-
24
-
25
-
26
-
27
-
28
-
29
-
30
-
31
-
32
-
33
-
34
-
35
-
36
-
37
-
38
-
39
-
40
-
41
-
42
-
43
-
44
-
45
-
46
-
47
-
48
-
49
-
50
-
51
-
52
-
53
-
54
-
55
-
56
-
57
-
58
-
59
-
60
-
61
-
62
-
63
-
64
-
65
-
66
-
67
-
68
-
69
-
70
-
71
-
72
-
73
-
74
-
75
-
76
-
77
-
78
-
79
-
80
-
81
-
82
-
83
-
84
-
85
-
86
-
87
-
88
-
89
-
90
-
91
-
92
-
93
-
94
-
95
-
96
-
97
-
98
-
99
-
100
-
101
-
102
-
103
-
104
-
105
-
106
-
107
-
108
-
109
-
110
-
111
-
112
-
113
-
114
-
115
-
116
-
117
-
118
-
119
-
120
-
121
-
122
-
123
-
124
-
125
-
126
-
127
-
128
-
129
-
130
-
131
-
132
-
133
-
134
-
135
-
136
-
137
-
138
-
139
-
140
-
141
-
142
-
143
-
144
-
145
-
146
-
147
-
148
-
149
-
150
-
151
-
152
-
153
-
154
-
155
-
156
-
157
-
158
-
159
-
160
-
161
-
162
-
163
-
164
-
165
-
166
-
167
-
168
-
169
-
170
-
171
-
172
 |
 |

4
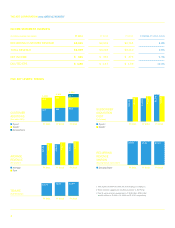
INCOME STATEMENT OVERVIEW
($ in millions, except per-share amounts) FY 2013 FY 2012 FY 2011 % CHANGE (FY 2013–2012)
RECURRING CUSTOMER REVENUE $3,041 $2,903 $2,765 4.8%
TOTAL REVENUE $3,309 $3,228 $3,110 2.5%
NET INCOME $ 421 $ 394 $ 376 6.9%
DILUTED EPS $ 1.88 $ 1.67 $ 1.59 12.6%
FIVE KEY LEVERS: TRENDS
1 New represents ARPU for both new and resale gross additions.
2 Direct includes upgrades for existing customers to ADT Pulse.
3 Cost to serve is before special items of $28 million, $18 million
and $1 million for FY 2011, FY 2012 and FY 2013 respectively.
FY 2011 FY 2012
TENURE
(T12M Net Attrition)
12.7% 13.5% 13.9%
FY 2013
CUSTOMER
ADDITIONS
(Gross adds in 000’s)
597
491
FY 2011
1,088
634
527
FY 2012
1,161
Direct
Dealer
Acquisitions
654
453
1,224
FY 2013
117
FY 2011 FY 2012
$1,157
$1,255
$1,115
$1,212
SUBSCRIBER
ACQUISITION
COST
(Per Customer)
$1,341
$1,258
FY 2013
Direct
2
Dealer
FY 2011 FY 2012
RECURRING
REVENUE
MARGIN
(Recurring Revenue—Cost to Serve)
67.8% 67.5% 67.1%
FY 2013
Existing Base
FY 2011 FY 2012
AVERAGE
REVENUE
(Per Customer)
FY 2013
$37.24
$40.55
$42.02
$38.87
$43.94
$40.31
Average
New
THE ADT CORPORATION 2013 ANNUAL REPORT