ADT 2013 Annual Report Download - page 38
Download and view the complete annual report
Please find page 38 of the 2013 ADT annual report below. You can navigate through the pages in the report by either clicking on the pages listed below, or by using the keyword search tool below to find specific information within the annual report.-
 1
1 -
2
-
3
-
4
-
5
-
6
-
7
-
8
-
9
-
10
-
11
-
12
-
13
-
14
-
15
-
16
-
17
-
18
-
19
-
20
-
21
-
22
-
23
-
24
-
25
-
26
-
27
-
 28
28 -
 29
29 -
 30
30 -
 31
31 -
 32
32 -
 33
33 -
 34
34 -
 35
35 -
 36
36 -
 37
37 -
 38
38 -
 39
39 -
 40
40 -
 41
41 -
 42
42 -
 43
43 -
 44
44 -
 45
45 -
 46
46 -
 47
47 -
 48
48 -
49
-
50
-
51
-
52
-
53
-
54
-
55
-
56
-
57
-
58
-
59
-
60
-
61
-
62
-
63
-
64
-
65
-
66
-
67
-
68
-
69
-
70
-
71
-
72
-
73
-
74
-
75
-
76
-
77
-
78
-
79
-
80
-
81
-
82
-
83
-
84
-
85
-
86
-
87
-
88
-
89
-
90
-
91
-
92
-
93
-
94
-
95
-
96
-
97
-
98
-
99
-
100
-
101
-
102
-
103
-
104
-
105
-
106
-
107
-
108
-
109
-
110
-
111
-
112
-
113
-
114
-
115
-
116
-
117
-
118
-
119
-
120
-
121
-
122
-
123
-
124
-
125
-
126
-
127
-
128
-
129
-
130
-
131
-
132
-
133
-
134
-
135
-
136
-
137
-
138
-
139
-
140
-
141
-
142
-
143
-
144
-
145
-
146
-
147
-
148
-
149
-
150
-
151
-
152
-
153
-
154
-
155
-
156
-
157
-
158
-
159
-
160
-
161
-
162
-
163
-
164
-
165
-
166
-
167
-
168
-
169
-
170
-
171
-
172
 |
 |

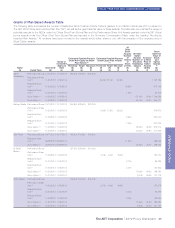
COMPENSATION OF EXECUTIVE OFFICERS—CONTINUED
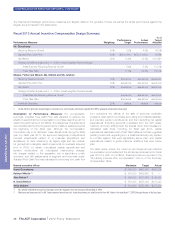
The following table represents the peer group utilized by the
Compensation Committee in its review of the Company’s fiscal year
2013 compensation programs and individual executive compensation
decisions. All data in the table was provided by S&P Capital IQ.
Company Name (1) Revenues (2)
Operating
Income (2)
Total
Assets (2)
Market
Cap (3)
Cablevision Systems Corp. $ 6,705 $ 849 $ 7,246 $ 3,995
CenturyLink, Inc. $18,376 $2,796 $ 54,020 $ 18,973
Charter Communications, Inc. $ 7,504 $ 931 $ 15,599 $ 13,401
Equinix, Inc. $ 1,896 $ 419 $ 6,133 $ 8,272
Frontier Communications Corp. $ 5,012 $1,101 $ 17,734 $ 4,898
Netflix, Inc. $ 3,609 $ 50 $ 3,968 $ 20,726
Rollins, Inc. $ 1,271 $ 177 $ 693 $ 4,057
SIRIUS XM Radio, Inc. $ 3,402 $ 872 $ 9,055 $ 23,683
Stanley Black & Decker, Inc. $10,191 $1,140 $ 15,844 $ 12,827
STARZ $ 1,631 $ 423 $ 2,176 $ 3,289
Telephone & Data Systems, Inc. $ 5,345 $ 245 $ 8,624 $ 3,216
The Brink’s Co. $ 3,842 $ 165 $ 2,554 $ 1,559
Tyco International Ltd. $10,403 $ 837 $ 12,365 $ 17,160
Windstream Corp. $ 6,156 $ 980 $ 13,982 $ 4,918
25TH PERCENTILE $ 3,454 $ 289 $ 4,509 $ 4,011
MEDIAN $ 5,179 $ 843 $ 8,839 $ 6,595
75TH PERCENTILE $ 7,304 $ 968 $15,195 $16,220
The ADT Corporation $ 3,228 $ 722 $ 9,260 $ 9,105
PERCENT RANK 22% 44% 54% 55%
(1) Two additional companies, DIRECTV and Ascent Capital Group, are included as “reference peers” for purposes of assessing compensation design and practices only. While these companies
meet the subscription-based recurring revenue and B2C screening criteria, their annual revenues are outside the range used in the screening process. As a result, utilizing specific
compensation data may possibly skew comparative statistics.
(2) Data presented is as of each company’s most recently reported fiscal year end, with the exception of ADT and Tyco, whose data is as of their fiscal year 2012 10-K filings (which were, at the
time of the Compensation Committee’s review of executive compensation, the most recently reported data).
(3) Data presented is as of November 15, 2013.
FY14 Peer Group
Based on a review of recommendations made by Farient at the
December 2013 Compensation Committee meeting, the Committee
approved the following changes to the peer group for fiscal year
2014:
•the removal of Equinix and STARZ; and
•the addition of Allegion, Cincinnati Bell and Earthlink and, as a
reference peer only, T-Mobile US.
Equinix and STARZ were removed from the peer group due primarily
to their business-to-business (B2B) focus. Additionally, Equinix is
focused primarily on enterprise solutions, while STARZ has a focus on
selling programming to distributors, neither of which is a business
model comparable to the Company’s. The three additions to the peer
group all provide services to residential consumers: Allegion provides
security and safety-related products and services, Cincinnati Bell
offers voice and data services, as well as home security, and
Earthlink provides network, communication and IT services. T-Mobile
US was added as a reference peer due to its acquisition of a former
member of the Company’s peer group (MetroPCS). T-Mobile US also
has a subscriber-based recurring revenue business model, but its
size is outside the range of the screening criteria used to identify peer
companies.
The revised peer group will be used to help the Compensation
Committee establish pay decisions during fiscal year 2014.
Components of Compensation Programs
The target total compensation opportunity for each of our Executive
Officers is comprised of both fixed (base salary) and variable (both
annual and long-term incentives) compensation elements. In addition,
each of our NEOs is eligible to participate in the Company’s benefit
plans that are generally available to all employees.
Base Salary
Base salaries, which comprise the fixed portion of our executives’
compensation, are reviewed annually by the Compensation
Committee. In addition, the Compensation Committee also reviews
base salaries periodically in situations of promotion or other change in
job responsibilities. These reviews are based upon market data,
internal pay equity and the individual executive’s performance, level of
experience and level of responsibility.
26 The ADT Corporation 2014 Proxy Statement
PROXY STATEMENT