ADT 2013 Annual Report Download - page 49
Download and view the complete annual report
Please find page 49 of the 2013 ADT annual report below. You can navigate through the pages in the report by either clicking on the pages listed below, or by using the keyword search tool below to find specific information within the annual report.-
 1
1 -
2
-
3
-
4
-
5
-
6
-
7
-
8
-
9
-
10
-
11
-
12
-
13
-
14
-
15
-
16
-
17
-
18
-
19
-
20
-
21
-
22
-
23
-
24
-
25
-
26
-
27
-
28
-
29
-
30
-
31
-
32
-
33
-
34
-
35
-
36
-
37
-
38
-
 39
39 -
 40
40 -
 41
41 -
 42
42 -
 43
43 -
 44
44 -
 45
45 -
 46
46 -
 47
47 -
 48
48 -
 49
49 -
 50
50 -
 51
51 -
 52
52 -
 53
53 -
 54
54 -
 55
55 -
 56
56 -
 57
57 -
 58
58 -
 59
59 -
60
-
61
-
62
-
63
-
64
-
65
-
66
-
67
-
68
-
69
-
70
-
71
-
72
-
73
-
74
-
75
-
76
-
77
-
78
-
79
-
80
-
81
-
82
-
83
-
84
-
85
-
86
-
87
-
88
-
89
-
90
-
91
-
92
-
93
-
94
-
95
-
96
-
97
-
98
-
99
-
100
-
101
-
102
-
103
-
104
-
105
-
106
-
107
-
108
-
109
-
110
-
111
-
112
-
113
-
114
-
115
-
116
-
117
-
118
-
119
-
120
-
121
-
122
-
123
-
124
-
125
-
126
-
127
-
128
-
129
-
130
-
131
-
132
-
133
-
134
-
135
-
136
-
137
-
138
-
139
-
140
-
141
-
142
-
143
-
144
-
145
-
146
-
147
-
148
-
149
-
150
-
151
-
152
-
153
-
154
-
155
-
156
-
157
-
158
-
159
-
160
-
161
-
162
-
163
-
164
-
165
-
166
-
167
-
168
-
169
-
170
-
171
-
172
 |
 |

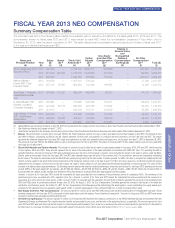
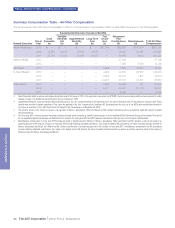
FISCAL YEAR 2013 NEO COMPENSATION—CONTINUED
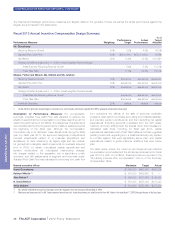
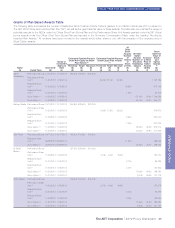
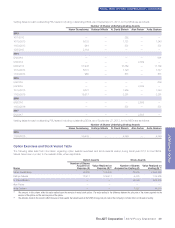
Outstanding Equity Awards at Fiscal Year-End Table
The following table shows outstanding Stock Option awards classified as exercisable and unexercisable and the number and value of any
unvested or unearned equity awards outstanding as of September 27, 2013 for each of the NEOs. The value of any unvested or unearned
equity awards outstanding is calculated based on a market value of $41.26, which was the NYSE closing price per share of the Company’s
common stock on September 27, 2013.
Option Awards (1) Stock Awards
Name
Number of
Securities
Underlying
Unexercised
Options: (#)
Exercisable
Number of
Securities
Underlying
Unexercised
Options: (#)
UnExercisable
Option
Exercise
Price
($)
Option
Expiration
Date
Number of
Shares or Units
of Stock That
Have Not Vested
(#)(2)
Market Value of
Shares or Units
of Stock That
Have Not
Vested
($)(3)
Equity
Incentive Plan
Awards:
Number of
Unearned
Shares, Units
or Other Rights
That Have Not
Vested
(#)(4)
Equity Incentive
Plan Awards:
Market or
Payout Value of
Unearned
Shares, Units or
Other Rights
That Have Not
Vested
($)(3)
Naren 31,138 — 36.4222 3/9/2015 94,890 3,915,161 38,535 1,589,954
Gursahaney 39,309 — 29.5082 11/21/2015
14,741 — 31.1718 1/11/2016
137,587 — 30.8309 11/20/2016
110,850 — 34.1771 7/2/2017
54,644 — 28.4959 8/17/2018
201,873 — 18.5745 10/6/2018
111,474 37,159 21.6169 9/30/2019
61,982 61,983 23.8843 10/11/2020
26,073 78,220 28.3870 10/11/2021
— 131,400 45.9000 11/29/2022
— 65,700 45.9000 11/29/2022
Kathryn
Mikells (5)
—— — —
N. David 11,792 — 31.3397 6/19/2015 20,164 831,967 4,349 179,440
Bleisch 8,352 — 29.5082 11/21/2015
10,515 — 30.8309 11/20/2016
11,491 — 34.1771 7/2/2017
14,410 — 18.5745 10/6/2018
7,892 2,631 21.6169 9/30/2019
10,234 10,234 23.8843 10/11/2020
4,519 13,560 28.3870 10/11/2021
— 9,300 45.9000 11/29/2022
— 15,000 45.9000 11/29/2022
Alan Ferber — 38,700 44.4700 5/7/2023 11,234 463,515 —
Anita 6,679 13,356 31.1796 5/3/2021 21,200 874,712 4,349 179,440
Graham (6) 4,839 14,520 28.3870 10/11/2021
— 9,300 45.9000 11/29/2022
— 15,000 45.9000 11/29/2022
(1) Stock Options granted to the NEOs generally vest and become exercisable one-fourth per year on each anniversary of the grant date. Stock Options granted to the NEOs in conjunction with
the Founders’ Awards in fiscal year 2013 vest and become exercisable one-third per year on each anniversary of the grant date. Stock Options granted to the NEOs expire on the day prior to
the tenth anniversary of the grant date.
(2) The amounts shown in this column represent unvested awards of RSUs. Amounts include outstanding dividend equivalent units associated with the underlying RSU awards.
(3) The amounts in these columns represent the market value of the unvested RSU and PSU awards calculated using a price of $41.26, which was the closing price of the Company’s Common
Stock on the NYSE on September 27, 2013.
(4) The amounts shown in this column represent outstanding and unvested awards of PSUs. The number of PSUs is based on the number granted (target amount) and includes outstanding
dividend equivalent units associated with the underlying award. Dividend equivalent units will vest only to the extent the underlying awards vest based upon the Company’s performance
against its performance targets. The three-year performance period for the fiscal year 2013 grant ends on the last day of fiscal year 2015.
(5) Ms. Mikells’ employment with the Company terminated on May 2, 2013. In accordance with the treatment of equity upon termination of employment as defined in The ADT Corporation 2012
Stock and Incentive Plan, and in the terms and conditions of her individual equity awards, all outstanding RSUs, PSUs and unvested Stock Options were cancelled upon her date of
termination. Ms. Mikells had a period of 90 days post-termination to exercise any vested stock options, after which period any unvested stock options were cancelled.
(6) Ms. Graham’s employment with the Company terminated on December 31, 2013. In accordance with the treatment of equity upon termination of employment as defined in The ADT
Corporation 2012 Stock and Incentive Plan, and in the terms and conditions of her individual equity awards, all outstanding RSUs, PSUs and unvested Stock Options were cancelled upon
her date of termination. Ms. Graham has a period of 90 days post-termination to exercise any vested stock options, after which period any unvested stock options will be cancelled.
The ADT Corporation 2014 Proxy Statement 37
PROXY STATEMENT