ADT 2013 Annual Report Download - page 105
Download and view the complete annual report
Please find page 105 of the 2013 ADT annual report below. You can navigate through the pages in the report by either clicking on the pages listed below, or by using the keyword search tool below to find specific information within the annual report.-
 1
1 -
2
-
3
-
4
-
5
-
6
-
7
-
8
-
9
-
10
-
11
-
12
-
13
-
14
-
15
-
16
-
17
-
18
-
19
-
20
-
21
-
22
-
23
-
24
-
25
-
26
-
27
-
28
-
29
-
30
-
31
-
32
-
33
-
34
-
35
-
36
-
37
-
38
-
39
-
40
-
41
-
42
-
43
-
44
-
45
-
46
-
47
-
48
-
49
-
50
-
51
-
52
-
53
-
54
-
55
-
56
-
57
-
58
-
59
-
60
-
61
-
62
-
63
-
64
-
65
-
66
-
67
-
68
-
69
-
70
-
71
-
72
-
73
-
74
-
75
-
76
-
77
-
78
-
79
-
80
-
81
-
82
-
83
-
84
-
85
-
86
-
87
-
88
-
89
-
90
-
91
-
92
-
93
-
94
-
 95
95 -
 96
96 -
 97
97 -
 98
98 -
 99
99 -
 100
100 -
 101
101 -
 102
102 -
 103
103 -
 104
104 -
 105
105 -
 106
106 -
 107
107 -
 108
108 -
 109
109 -
 110
110 -
 111
111 -
 112
112 -
 113
113 -
 114
114 -
 115
115 -
116
-
117
-
118
-
119
-
120
-
121
-
122
-
123
-
124
-
125
-
126
-
127
-
128
-
129
-
130
-
131
-
132
-
133
-
134
-
135
-
136
-
137
-
138
-
139
-
140
-
141
-
142
-
143
-
144
-
145
-
146
-
147
-
148
-
149
-
150
-
151
-
152
-
153
-
154
-
155
-
156
-
157
-
158
-
159
-
160
-
161
-
162
-
163
-
164
-
165
-
166
-
167
-
168
-
169
-
170
-
171
-
172
 |
 |

FORM 10-K
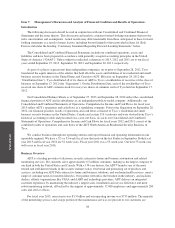
Gross Subscriber Acquisition Cost Expenses. Gross subscriber acquisition cost expenses represent the cost of
acquiring new customers reflected in our Consolidated and Combined Statements of Operations and include
advertising, marketing, and both direct and indirect selling costs for all new accounts as well as sales
commissions and installation equipment and labor costs.
Earnings before interest, taxes, depreciation and amortization (“EBITDA”). EBITDA is a non-GAAP measure
reflecting net income adjusted for interest, taxes and certain non-cash items which include depreciation of
subscriber system assets and other fixed assets, amortization of deferred costs and deferred revenue associated
with customer acquisitions, and amortization of dealer and other intangible assets. We believe EBITDA is useful
to provide investors with information about operating profits, adjusted for significant non-cash items, generated
from the existing customer base. A reconciliation of EBITDA to net income (the most comparable GAAP
measure) is provided under “Results of Operations—Non-GAAP Measures.”
Free Cash Flow (“FCF”). FCF is a non-GAAP measure that our management employs to measure cash that is
free from any significant existing obligation and is available to service debt and make investments. The
difference between net cash provided by operating activities (the most comparable GAAP measure) and FCF is
the deduction of cash outlays for capital expenditures, subscriber system assets, dealer generated customer
accounts and bulk account purchases. A reconciliation of FCF to net cash provided by operating activities is
provided under “Results of Operations—Non-GAAP Measures.”
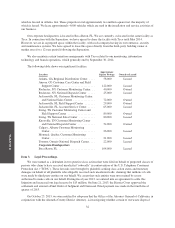
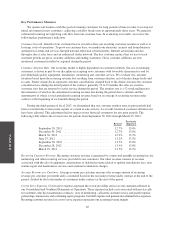
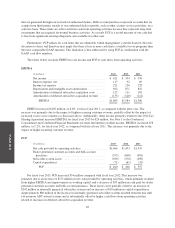
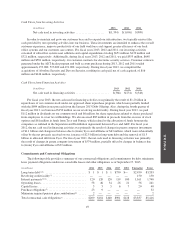
Results of Operations
(in millions, except as otherwise indicated) 2013 2012 2011
Recurring customer revenue ......................... $3,041 $ 2,903 $2,765
Other revenue .................................... 268 325 345
Total revenue ................................. 3,309 3,228 3,110
Operating income ................................. 735 722 693
Interest expense, net ............................... (117) (92) (89)
Other income ..................................... 24 — —
Income tax expense ................................ (221) (236) (228)
Net income ................................... $ 421 $ 394 $ 376
Summary Cash Flow Data:
Net cash provided by operating activities ........... $1,666 $ 1,493 $1,439
Net cash used in investing activities ............... (1,394) (1,096) (909)
Net cash used in financing activities ............... (366) (231) (548)
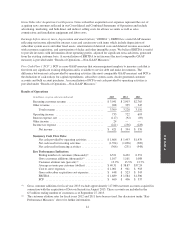
Key Performance Indicators:
Ending number of customers (thousands)(1) ......... 6,521 6,422 6,351
Gross customer additions (thousands)(1) ............ 1,107 1,161 1,088
Customer attrition rate (percent)(2) ................ 13.9% 13.5% 12.7%
Average revenue per customer (dollars) ............ $40.31 $ 38.87 $37.24
Cost to serve expenses .......................... $1,001 $ 961 $ 918
Gross subscriber acquisition cost expenses .......... $ 448 $ 523 $ 543
EBITDA ..................................... $1,689 $ 1,584 $1,506
FCF ........................................ $ 460 $ 406 $ 537
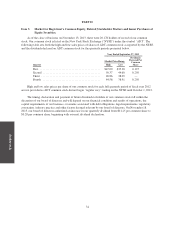
(1) Gross customer additions for fiscal year 2013 exclude approximately 117,000 customer accounts acquired in
connection with the acquisition of Devcon Security in August 2013. These accounts are included in the
6.5 million ending number of customers as of September 27, 2013.
(2) The customer attrition rates for fiscal years 2012 and 2011 have been revised. See discussion under “Key
Performance Measures” above for further information.
41