ADT 2013 Annual Report Download - page 159
Download and view the complete annual report
Please find page 159 of the 2013 ADT annual report below. You can navigate through the pages in the report by either clicking on the pages listed below, or by using the keyword search tool below to find specific information within the annual report.-
 1
1 -
2
-
3
-
4
-
5
-
6
-
7
-
8
-
9
-
10
-
11
-
12
-
13
-
14
-
15
-
16
-
17
-
18
-
19
-
20
-
21
-
22
-
23
-
24
-
25
-
26
-
27
-
28
-
29
-
30
-
31
-
32
-
33
-
34
-
35
-
36
-
37
-
38
-
39
-
40
-
41
-
42
-
43
-
44
-
45
-
46
-
47
-
48
-
49
-
50
-
51
-
52
-
53
-
54
-
55
-
56
-
57
-
58
-
59
-
60
-
61
-
62
-
63
-
64
-
65
-
66
-
67
-
68
-
69
-
70
-
71
-
72
-
73
-
74
-
75
-
76
-
77
-
78
-
79
-
80
-
81
-
82
-
83
-
84
-
85
-
86
-
87
-
88
-
89
-
90
-
91
-
92
-
93
-
94
-
95
-
96
-
97
-
98
-
99
-
100
-
101
-
102
-
103
-
104
-
105
-
106
-
107
-
108
-
109
-
110
-
111
-
112
-
113
-
114
-
115
-
116
-
117
-
118
-
119
-
120
-
121
-
122
-
123
-
124
-
125
-
126
-
127
-
128
-
129
-
130
-
131
-
132
-
133
-
134
-
135
-
136
-
137
-
138
-
139
-
140
-
141
-
142
-
143
-
144
-
145
-
146
-
147
-
148
-
 149
149 -
 150
150 -
 151
151 -
 152
152 -
 153
153 -
 154
154 -
 155
155 -
 156
156 -
 157
157 -
 158
158 -
 159
159 -
 160
160 -
 161
161 -
 162
162 -
 163
163 -
 164
164 -
 165
165 -
 166
166 -
 167
167 -
 168
168 -
 169
169 -
170
-
171
-
172
 |
 |

FORM 10-K
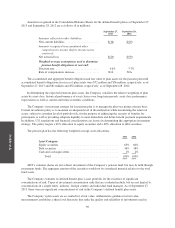
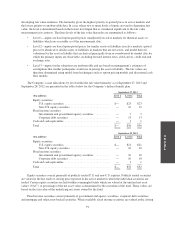
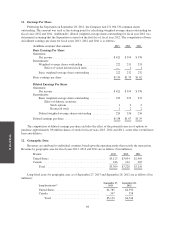
The following table summarizes the stock option activity for fiscal year 2013:
Shares
Weighted-
Average
Exercise Price
Weighted-
Average
Remaining
Contractual
Term
(in years)
Aggregate
Intrinsic
Value
($ in millions)
Outstanding as of September 28, 2012 .... 7,837,941 $26.97
Granted ............................ 1,045,399 45.41
Exercised ........................... 3,205,566 26.72
Canceled ........................... 381,714 32.70
Outstanding as of September 27, 2013 .... 5,296,060 30.34 5.83 $62
Options vested and expected to vest as of
September 27, 2013 ................. 5,035,301 30.12 5.71 60
Exercisable as of September 27, 2013 ..... 3,123,350 27.44 4.22 43
As of September 27, 2013, there was approximately $14 million of total unrecognized compensation
expense related to non-vested stock options granted under the Company’s share option plan. This expense, net of
forfeitures, is expected to be recognized over a weighted-average period of approximately 3 years.
Restricted Stock Units—Restricted stock units are granted subject to certain restrictions. Conditions of
vesting are determined at the time of grant under the Plan. Restrictions on the award generally lapse upon normal
retirement, if more than twelve months from the grant date, and death or disability of the employee. Recipients of
restricted stock units have no voting rights and receive dividend equivalent units. Dividend equivalent units are
subject to forfeiture if the underlying awards do not vest. The total number of restricted stock units issued during
fiscal year 2013 includes an immaterial number of deferred stock units.
The fair market value of restricted stock units, both time vesting and those subject to specific performance
criteria, are expensed over the period of vesting. Restricted stock units that vest based upon passage of time
generally vest over a period of four years. Restricted stock units that vest dependent upon attainment of various
levels of performance (“performance share awards”) generally vest in their entirety three years from the grant
date. The fair value of all restricted stock units is determined based on the closing market price of the underlying
stock on the grant date. The number of performance share awards included in the total restricted stock units
granted during fiscal year 2013 is immaterial. No performance share awards vested during fiscal year 2013.
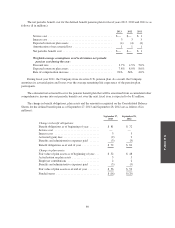
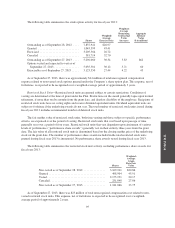
The following table summarizes the restricted stock unit activity, including performance share awards, for
fiscal year 2013:
Shares
Weighted-
Average
Grant-
Date Fair
Value
Non-vested as of September 28, 2012 ............... 3,169,241 $20.86
Granted ....................................... 498,904 45.91
Vested ........................................ 2,175,231 20.17
Canceled ...................................... 251,848 27.86
Non-vested as of September 27, 2013 ............... 1,241,066 33.75
As of September 27, 2013, there was $23 million of total unrecognized compensation cost related to non-
vested restricted stock units. This expense, net of forfeitures is expected to be recognized over a weighted-
average period of approximately 2 years.
95