ADT 2013 Annual Report Download - page 110
Download and view the complete annual report
Please find page 110 of the 2013 ADT annual report below. You can navigate through the pages in the report by either clicking on the pages listed below, or by using the keyword search tool below to find specific information within the annual report.-
 1
1 -
2
-
3
-
4
-
5
-
6
-
7
-
8
-
9
-
10
-
11
-
12
-
13
-
14
-
15
-
16
-
17
-
18
-
19
-
20
-
21
-
22
-
23
-
24
-
25
-
26
-
27
-
28
-
29
-
30
-
31
-
32
-
33
-
34
-
35
-
36
-
37
-
38
-
39
-
40
-
41
-
42
-
43
-
44
-
45
-
46
-
47
-
48
-
49
-
50
-
51
-
52
-
53
-
54
-
55
-
56
-
57
-
58
-
59
-
60
-
61
-
62
-
63
-
64
-
65
-
66
-
67
-
68
-
69
-
70
-
71
-
72
-
73
-
74
-
75
-
76
-
77
-
78
-
79
-
80
-
81
-
82
-
83
-
84
-
85
-
86
-
87
-
88
-
89
-
90
-
91
-
92
-
93
-
94
-
95
-
96
-
97
-
98
-
99
-
 100
100 -
 101
101 -
 102
102 -
 103
103 -
 104
104 -
 105
105 -
 106
106 -
 107
107 -
 108
108 -
 109
109 -
 110
110 -
 111
111 -
 112
112 -
 113
113 -
 114
114 -
 115
115 -
 116
116 -
 117
117 -
 118
118 -
 119
119 -
 120
120 -
121
-
122
-
123
-
124
-
125
-
126
-
127
-
128
-
129
-
130
-
131
-
132
-
133
-
134
-
135
-
136
-
137
-
138
-
139
-
140
-
141
-
142
-
143
-
144
-
145
-
146
-
147
-
148
-
149
-
150
-
151
-
152
-
153
-
154
-
155
-
156
-
157
-
158
-
159
-
160
-
161
-
162
-
163
-
164
-
165
-
166
-
167
-
168
-
169
-
170
-
171
-
172
 |
 |

FORM 10-K
that are generated through our network of authorized dealers. Bulk account purchases represent accounts that we
acquire from third parties outside of our authorized dealer network, such as other security service providers, on a
selective basis. These items are subtracted from cash from operating activities because they represent long-term
investments that are required for normal business activities. As a result, FCF is a useful measure of our cash that
is free from significant existing obligations and available for other uses.
Furthermore, FCF adjusts for cash items that are ultimately within management’s and the board of directors’
discretion to direct and therefore may imply that there is less or more cash that is available for our programs than
the most comparable GAAP measure. This limitation is best addressed by using FCF in combination with the
GAAP cash flow numbers.
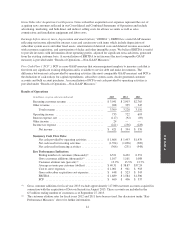
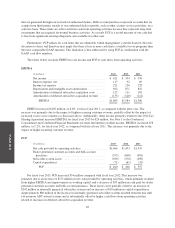
The tables below reconcile EBITDA to net income and FCF to cash flows from operating activities.
EBITDA
(in millions) 2013 2012 2011
Net income ........................................ $ 421 $ 394 $ 376
Interest expense, net ................................. 117 92 89
Income tax expense ................................. 221 236 228
Depreciation and intangible asset amortization ............ 942 871 825
Amortization of deferred subscriber acquisition costs . . . . . . . 123 111 102
Amortization of deferred subscriber acquisition revenue .... (135) (120) (114)
EBITDA ...................................... $1,689 $1,584 $1,506
EBITDA increased $105 million, or 6.6%, for fiscal year 2013, as compared with the prior year. The
increase was primarily due to the impact of higher recurring customer revenue, partially offset by the impact of
increased cost to serve expenses as discussed above. Additionally, other income primarily related to the 2012 Tax
Sharing Agreement increased EBITDA for fiscal year 2013 by $24 million. See Note 1 to the Condensed,
Consolidated and Combined Financial Statements for more information on other income. EBITDA increased $78
million, or 5.2%, for fiscal year 2012, as compared with fiscal year 2011. This increase was primarily due to the
impact of higher recurring customer revenue.
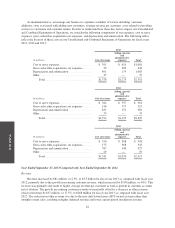
FCF
(in millions) 2013 2012 2011
Net cash provided by operating activities ................ $1,666 $1,493 $1,439
Dealer generated customer accounts and bulk account
purchases ....................................... (555) (648) (581)
Subscriber system assets ............................. (580) (378) (290)
Capital expenditures ................................. (71) (61) (31)
FCF.......................................... $ 460 $ 406 $ 537
For fiscal year 2013, FCF increased $54 million compared with fiscal year 2012. This increase was
primarily due to an increase of $173 million in net cash provided by operating activities, which primarily resulted
from higher EBITDA and improvements in working capital, and a decrease of $93 million in cash paid for dealer
generated customer accounts and bulk account purchases. These factors were partially offset by an increase of
$202 million in internally generated subscriber systems and an increase of $10 million in capital expenditures.
Approximately $80 million of the increase in internally generated subscriber systems resulted from the mix shift
toward more ADT-owned systems and is substantially offset by higher cash flows from operating activities
related to increases in deferred subscriber acquisition revenue.
46