ADT 2013 Annual Report Download - page 111
Download and view the complete annual report
Please find page 111 of the 2013 ADT annual report below. You can navigate through the pages in the report by either clicking on the pages listed below, or by using the keyword search tool below to find specific information within the annual report.-
 1
1 -
2
-
3
-
4
-
5
-
6
-
7
-
8
-
9
-
10
-
11
-
12
-
13
-
14
-
15
-
16
-
17
-
18
-
19
-
20
-
21
-
22
-
23
-
24
-
25
-
26
-
27
-
28
-
29
-
30
-
31
-
32
-
33
-
34
-
35
-
36
-
37
-
38
-
39
-
40
-
41
-
42
-
43
-
44
-
45
-
46
-
47
-
48
-
49
-
50
-
51
-
52
-
53
-
54
-
55
-
56
-
57
-
58
-
59
-
60
-
61
-
62
-
63
-
64
-
65
-
66
-
67
-
68
-
69
-
70
-
71
-
72
-
73
-
74
-
75
-
76
-
77
-
78
-
79
-
80
-
81
-
82
-
83
-
84
-
85
-
86
-
87
-
88
-
89
-
90
-
91
-
92
-
93
-
94
-
95
-
96
-
97
-
98
-
99
-
100
-
 101
101 -
 102
102 -
 103
103 -
 104
104 -
 105
105 -
 106
106 -
 107
107 -
 108
108 -
 109
109 -
 110
110 -
 111
111 -
 112
112 -
 113
113 -
 114
114 -
 115
115 -
 116
116 -
 117
117 -
 118
118 -
 119
119 -
 120
120 -
 121
121 -
122
-
123
-
124
-
125
-
126
-
127
-
128
-
129
-
130
-
131
-
132
-
133
-
134
-
135
-
136
-
137
-
138
-
139
-
140
-
141
-
142
-
143
-
144
-
145
-
146
-
147
-
148
-
149
-
150
-
151
-
152
-
153
-
154
-
155
-
156
-
157
-
158
-
159
-
160
-
161
-
162
-
163
-
164
-
165
-
166
-
167
-
168
-
169
-
170
-
171
-
172
 |
 |

FORM 10-K
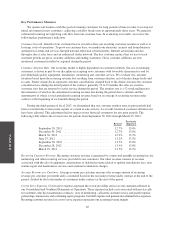
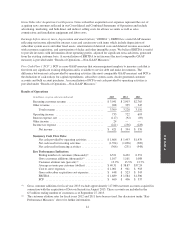
For fiscal year 2012, FCF decreased $131 million compared with fiscal year 2011. This decrease was
primarily due to higher cash spend on dealer generated customer accounts and bulk account purchases of $67
million and higher investments in internally generated subscriber systems and capital expenditures of $88 million
and $30 million, respectively. This decrease was partially offset by an increase of $54 million in net cash
provided by operating activities due to higher EBITDA.
Liquidity and Capital Resources
Liquidity and Cash Flow Analysis
Significant factors driving our liquidity position include cash flows generated from operating activities and
investments in internally generated subscriber systems and dealer generated customer accounts. Our cash flows
from operations includes cash received from monthly recurring revenue and upfront installation fees received
from customers, less cash costs to provide services to our customers, including general and administrative costs
and certain costs associated with acquiring new customers. Historically, we have generated and expect to
continue to generate positive cash flow from operations. Prior to the Separation, our cash was regularly “swept”
by Tyco at its discretion in conjunction with its centralized approach to cash management and financing of
operations. Transfers of cash both to and from Tyco’s cash management system are reflected as changes in parent
company investment in the Consolidated and Combined Statements of Cash Flows for fiscal years 2012 and
2011.
Liquidity
At September 27, 2013, we had $138 million in cash and equivalents and another $600 million available
under our $750 million revolving credit facility. Our primary future cash needs are centered on operating
activities, working capital, capital expenditures, strategic investments and dividends. In addition, we may use
cash to repurchase shares of our common stock under our share repurchase program. We believe our cash
position, amounts available under our revolving credit facility and cash provided by operating activities will be
adequate to cover our operational and business needs in the next twelve months.
At September 27, 2013, we had $150 million outstanding under our revolving credit facility, all of which
was borrowed during the fourth quarter of fiscal year 2013. During the quarter ended September 27, 2013,
average borrowings under the facility totaled approximately $41 million at an average interest rate of 1.609%.
There were no borrowings under the facility during the first three quarters of fiscal year 2013. During October
2013, the $150 million in borrowings under the revolving credit facility were repaid using a portion of the cash
proceeds from the debt issuance described below.
On January 14, 2013, we issued $700 million aggregate principal amount of 4.125% unsecured notes due
2023 to certain institutional investors pursuant to certain exemptions from registration under the Securities Act of
1933, as amended (the “January 2013 Debt Offering”). Net cash proceeds from the issuance of this term
indebtedness totaled $694 million and were primarily used for the repurchase of outstanding shares of our
common stock. Interest is payable on June 15 and December 15 of each year, and the first payment was made on
June 15, 2013. We may redeem the notes, in whole or in part, at any time prior to the maturity date at a
redemption price equal to the greater of the principal amount of the notes to be redeemed, or a make-whole
premium, plus in each case, accrued and unpaid interest to, but excluding, the redemption date.
On October 1, 2013, we issued $1.0 billion aggregate principal amount of 6.250% unsecured notes due
October 2021 to certain institutional investors pursuant to certain exemptions from registration under the
Securities Act of 1933, as amended. Net cash proceeds from the issuance of this term indebtedness totaled $987
million, of which $150 million was used to repay the outstanding borrowings under our revolving credit facility
as of September 27, 2013. The remaining net proceeds will be used for repurchases of outstanding shares of our
common stock and acquisitions. Interest is payable on April 15 and October 15 of each year, commencing on
47