ADT 2013 Annual Report Download - page 36
Download and view the complete annual report
Please find page 36 of the 2013 ADT annual report below. You can navigate through the pages in the report by either clicking on the pages listed below, or by using the keyword search tool below to find specific information within the annual report.-
 1
1 -
2
-
3
-
4
-
5
-
6
-
7
-
8
-
9
-
10
-
11
-
12
-
13
-
14
-
15
-
16
-
17
-
18
-
19
-
20
-
21
-
22
-
23
-
24
-
25
-
 26
26 -
 27
27 -
 28
28 -
 29
29 -
 30
30 -
 31
31 -
 32
32 -
 33
33 -
 34
34 -
 35
35 -
 36
36 -
 37
37 -
 38
38 -
 39
39 -
 40
40 -
 41
41 -
 42
42 -
 43
43 -
 44
44 -
 45
45 -
 46
46 -
47
-
48
-
49
-
50
-
51
-
52
-
53
-
54
-
55
-
56
-
57
-
58
-
59
-
60
-
61
-
62
-
63
-
64
-
65
-
66
-
67
-
68
-
69
-
70
-
71
-
72
-
73
-
74
-
75
-
76
-
77
-
78
-
79
-
80
-
81
-
82
-
83
-
84
-
85
-
86
-
87
-
88
-
89
-
90
-
91
-
92
-
93
-
94
-
95
-
96
-
97
-
98
-
99
-
100
-
101
-
102
-
103
-
104
-
105
-
106
-
107
-
108
-
109
-
110
-
111
-
112
-
113
-
114
-
115
-
116
-
117
-
118
-
119
-
120
-
121
-
122
-
123
-
124
-
125
-
126
-
127
-
128
-
129
-
130
-
131
-
132
-
133
-
134
-
135
-
136
-
137
-
138
-
139
-
140
-
141
-
142
-
143
-
144
-
145
-
146
-
147
-
148
-
149
-
150
-
151
-
152
-
153
-
154
-
155
-
156
-
157
-
158
-
159
-
160
-
161
-
162
-
163
-
164
-
165
-
166
-
167
-
168
-
169
-
170
-
171
-
172
 |
 |

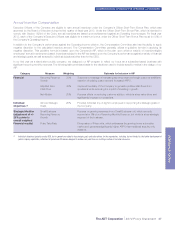
COMPENSATION OF EXECUTIVE OFFICERS—CONTINUED
additional incentives for our executives to focus on sustainable, long-
term growth.
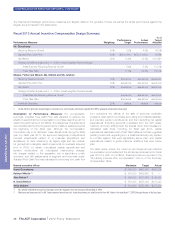
As a new public company beginning in fiscal year 2013, the
Compensation Committee felt it was important to set aggressive
targets in our incentive plans in order to focus our executives on
taking appropriate actions to ensure the Company is well-positioned
for long-term success. In fiscal year 2013, we did not fully meet the
aggressive financial targets set in our Annual Incentive Plan, but
outperformed against the strategic modifier metrics (see the
performance targets and actual performance in “Fiscal Year 2013
Annual Incentive Compensation Design Summary” below). As a
result, our CEO was awarded an annual incentive equal to 77% of his
targeted annual payout. Our other NEOs (with the exception of
Ms. Mikells, who forfeited her annual incentive award when she
resigned from the Company during the fiscal year) received an
average payout of 74.2% of their targeted award, including the impact
of their performance against individual objectives. The Compensation
Committee believes this result reflects proper alignment of pay and
performance. The Compensation Committee set equally aggressive
targets for fiscal year 2014 to ensure the relationship with
performance continues.
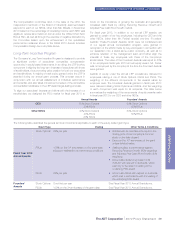
The fiscal year 2013 long-term incentive programs were also
designed to reward management for performance directly related to
increasing stockholder value. Our CEO received 50%, and the other
executives 40%, of long-term incentive value in stock options, which
deliver value only when long-term stock price appreciation is
achieved. The remaining 50% of the long-term incentive value for our
CEO and an additional 40% for the other executives was comprised
of Performance Share Units (“PSUs”), where vesting of shares is
contingent upon achieving Recurring Revenue Growth and Adjusted
Free Cash Flow Growth goals over a three-year performance period.
Our NEOs other than the CEO received 20% of their long-term
incentive value in Restricted Stock Units (“RSUs”), which deliver
higher value when there is long-term stock price appreciation.
Although the Company did not utilize a Total Shareholder Return
(“TSR”) metric in our fiscal year 2013 compensation programs, we
tracked our TSR throughout the year for two main purposes:
•as an additional data point in the overall assessment of
performance of the Company, particularly as we assessed the
performance of our executives relative to their compensation; and
•in anticipation of potentially utilizing a TSR metric in future years’
long-term incentive compensation design.
The Compensation Committee has determined that, in order to better
align our executive compensation with the value created for our
stockholders, Relative TSR will replace the Recurring Revenue Growth
metric as a metric for the PSUs granted during the 2014 fiscal year.
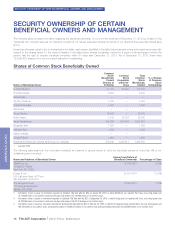
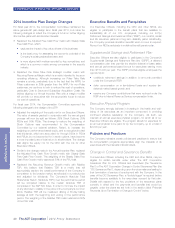
The following graph provides a comparison of the cumulative total
shareholder return on the Company’s common stock to the returns of
the Standard & Poor’s (“S&P”) 500 Index and the S&P 500 Industrial
Index from October 1, 2012 (the first day of fiscal year 2013) through
September 27, 2013. The graph is not, and is not intended to be,
indicative of future performance of our common stock.
The above graph assumes the following:
(1) $100 invested at the close of business on October 1, 2012, in
ADT common stock, S&P 500 Index, and the S&P 500 Industrial
Index.
(2) The cumulative total return assumes reinvestment of dividends.
The Compensation Committee believes that the annual incentive
awards earned by the NEOs, in comparison to the performance of
the Company’s stock relative to the S&P 500 Index and the S&P 500
Industrial Index, reflect a proper alignment of pay and performance.
Process for Determining Executive Officer
Compensation (including NEOs)
Role of the Compensation Committee
The Compensation Committee consists exclusively of independent
directors also considered “outside directors” as defined in
Section 162(m) of the Internal Revenue Code (the “Code”), and is
responsible for, among other things, reviewing the performance of
and approving the compensation awarded to our Executive Officers,
other “senior officers” subject to the filing requirements of Section 16
24 The ADT Corporation 2014 Proxy Statement
PROXY STATEMENT