ADT 2008 Annual Report Download - page 7
Download and view the complete annual report
Please find page 7 of the 2008 ADT annual report below. You can navigate through the pages in the report by either clicking on the pages listed below, or by using the keyword search tool below to find specific information within the annual report.-
 1
1 -
 2
2 -
 3
3 -
 4
4 -
 5
5 -
 6
6 -
 7
7 -
 8
8 -
 9
9 -
 10
10 -
 11
11 -
 12
12 -
 13
13 -
 14
14 -
 15
15 -
 16
16 -
 17
17 -
 18
18 -
19
-
20
-
21
-
22
-
23
-
24
-
25
-
26
-
27
-
28
-
29
-
30
-
31
-
32
-
33
-
34
-
35
-
36
-
37
-
38
-
39
-
40
-
41
-
42
-
43
-
44
-
45
-
46
-
47
-
48
-
49
-
50
-
51
-
52
-
53
-
54
-
55
-
56
-
57
-
58
-
59
-
60
-
61
-
62
-
63
-
64
-
65
-
66
-
67
-
68
-
69
-
70
-
71
-
72
-
73
-
74
-
75
-
76
-
77
-
78
-
79
-
80
-
81
-
82
-
83
-
84
-
85
-
86
-
87
-
88
-
89
-
90
-
91
-
92
-
93
-
94
-
95
-
96
-
97
-
98
-
99
-
100
-
101
-
102
-
103
-
104
-
105
-
106
-
107
-
108
-
109
-
110
-
111
-
112
-
113
-
114
-
115
-
116
-
117
-
118
-
119
-
120
-
121
-
122
-
123
-
124
-
125
-
126
-
127
-
128
-
129
-
130
-
131
-
132
-
133
-
134
-
135
-
136
-
137
-
138
-
139
-
140
-
141
-
142
-
143
-
144
-
145
-
146
-
147
-
148
-
149
-
150
-
151
-
152
-
153
-
154
-
155
-
156
-
157
-
158
-
159
-
160
-
161
-
162
-
163
-
164
-
165
-
166
-
167
-
168
-
169
-
170
-
171
-
172
-
173
-
174
-
175
-
176
-
177
-
178
-
179
-
180
-
181
-
182
-
183
-
184
-
185
-
186
-
187
-
188
-
189
-
190
-
191
-
192
-
193
-
194
-
195
-
196
-
197
-
198
-
199
-
200
-
201
-
202
-
203
-
204
-
205
-
206
-
207
-
208
-
209
-
210
-
211
-
212
-
213
-
214
-
215
-
216
-
217
-
218
-
219
-
220
-
221
-
222
-
223
-
224
-
225
-
226
-
227
-
228
-
229
-
230
-
231
-
232
-
233
-
234
-
235
-
236
-
237
-
238
-
239
-
240
-
241
-
242
-
243
-
244
-
245
-
246
-
247
-
248
-
249
-
250
-
251
-
252
-
253
-
254
-
255
-
256
-
257
-
258
-
259
-
260
-
261
-
262
-
263
-
264
-
265
-
266
-
267
-
268
-
269
-
270
-
271
-
272
-
273
-
274
-
275
-
276
-
277
-
278
-
279
-
280
-
281
-
282
-
283
 |
 |
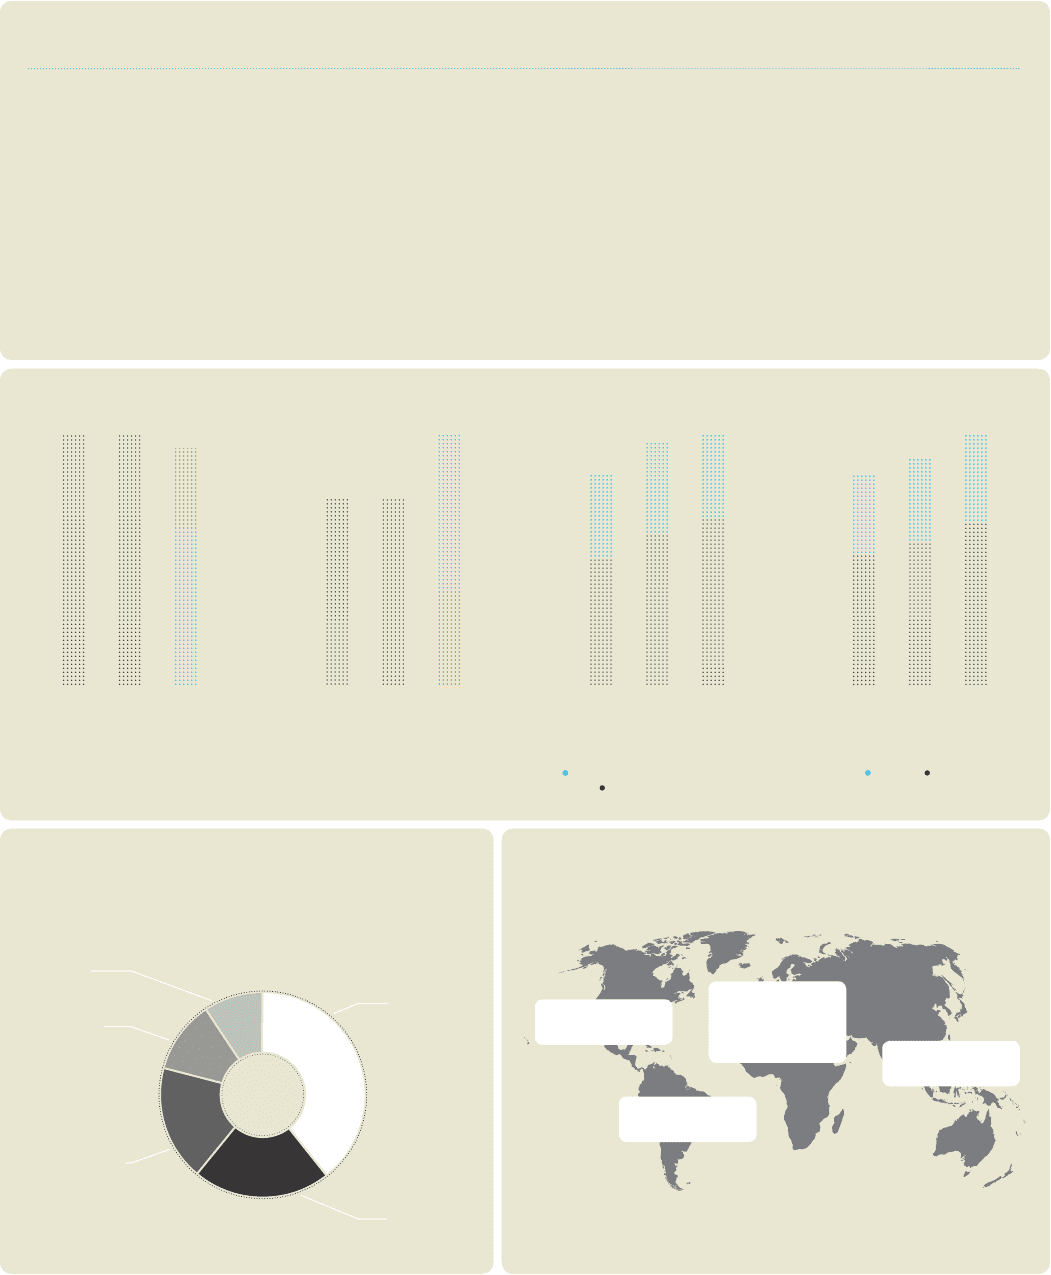
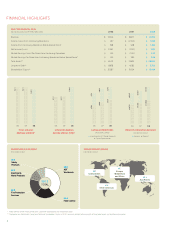
FINANCIAL HIGHLIGHTS
* These are Non-GAAP Financial Measures. See GAAP reconciliations on inside back cover.
** The decrease in Total Assets, Long-term Debt and Shareholders’ Equity in 2007 is primarily related to the spin-offs of Tyco’s electronics and healthcare businesses.
OPERATING MARGIN
BEFORE SPECIAL ITEMS*
PRODUCT AND SERVICE REVENUE
( IN US$ MILLIONS )
Service Product
CAPITAL EXPENDITURES
( IN US$ MILLIONS )
Investment in ADT Dealer Accounts
Capital Expenditures
TOTAL ORGANIC
REVENUE GROWTH*
2008 REVENUE BY SEGMENT
( IN US$ BILLIONS )
2008 REVENUE BY REGION
( IN US$ BILLIONS )
$1.9
Safety
Products
$2.3
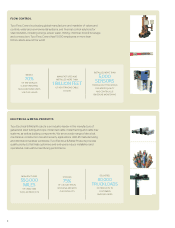
Electrical &
Metal Products
$3.6
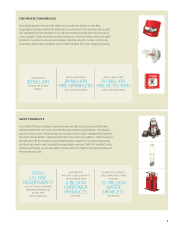
Fire Protection
Services
$4.4
Flow Control
$8.0
ADT
Worldwide
$20.2
TOTAL
$5.7
Europe,
Middle East
and Africa
$1.5
Other Americas
$3.3
Asia Paciic
$9.7
United States
SELECTED FINANCIAL DATA
( IN US$ MILLIONS, EXCEPT PER SHARE DATA ) 2006 2007 2008
Revenue $ 17,066 $ 18,477 $ 20,199
Income ( Loss ) from Continuing Operations $ 817 $ ( 2,524 ) $ 1,095
Income from Continuing Operations Before Special Items* $ 818 $ 948 $ 1,493
Net Income ( Loss ) $ 3,590 $ ( 1,742 ) $ 1,553
Diluted Earnings ( Loss ) Per Share from Continuing Operations $ 1.59 $ ( 5.10 ) $ 2.25
Diluted Earnings Per Share from Continuing Operations Before Special Items* $ 1.59 $ 1.89 $ 3.06
Total Assets** $ 63,011 $ 32,815 $ 28,804
Long-term Debt** $ 8,858 $ 4,082 $ 3,709
Shareholders’ Equity** $ 35,387 $ 15,624 $ 15,494
080706
8.1 %
8.2 %
11.0 %
080706
$10,731 $6,335
$6,661$11,816
$7,135$13,064
080706
$556 $373
$409$666
$376$734
080706
5.3 %
5.3 %
5.0 %
$1.9
Safety
Products
$2.3
Electrical &
Metal Products
$3.6
Fire Protection
Services
$4.4
Flow Control
$8.0
ADT
Worldwide
$20.2
TOTAL
8