ADT 2008 Annual Report Download - page 147
Download and view the complete annual report
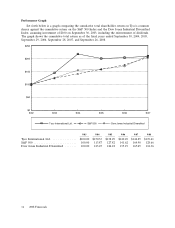
Please find page 147 of the 2008 ADT annual report below. You can navigate through the pages in the report by either clicking on the pages listed below, or by using the keyword search tool below to find specific information within the annual report.-
 1
1 -
2
-
3
-
4
-
5
-
6
-
7
-
8
-
9
-
10
-
11
-
12
-
13
-
14
-
15
-
16
-
17
-
18
-
19
-
20
-
21
-
22
-
23
-
24
-
25
-
26
-
27
-
28
-
29
-
30
-
31
-
32
-
33
-
34
-
35
-
36
-
37
-
38
-
39
-
40
-
41
-
42
-
43
-
44
-
45
-
46
-
47
-
48
-
49
-
50
-
51
-
52
-
53
-
54
-
55
-
56
-
57
-
58
-
59
-
60
-
61
-
62
-
63
-
64
-
65
-
66
-
67
-
68
-
69
-
70
-
71
-
72
-
73
-
74
-
75
-
76
-
77
-
78
-
79
-
80
-
81
-
82
-
83
-
84
-
85
-
86
-
87
-
88
-
89
-
90
-
91
-
92
-
93
-
94
-
95
-
96
-
97
-
98
-
99
-
100
-
101
-
102
-
103
-
104
-
105
-
106
-
107
-
108
-
109
-
110
-
111
-
112
-
113
-
114
-
115
-
116
-
117
-
118
-
119
-
120
-
121
-
122
-
123
-
124
-
125
-
126
-
127
-
128
-
129
-
130
-
131
-
132
-
133
-
134
-
135
-
136
-
 137
137 -
 138
138 -
 139
139 -
 140
140 -
 141
141 -
 142
142 -
 143
143 -
 144
144 -
 145
145 -
 146
146 -
 147
147 -
 148
148 -
 149
149 -
 150
150 -
 151
151 -
 152
152 -
 153
153 -
 154
154 -
 155
155 -
 156
156 -
 157
157 -
158
-
159
-
160
-
161
-
162
-
163
-
164
-
165
-
166
-
167
-
168
-
169
-
170
-
171
-
172
-
173
-
174
-
175
-
176
-
177
-
178
-
179
-
180
-
181
-
182
-
183
-
184
-
185
-
186
-
187
-
188
-
189
-
190
-
191
-
192
-
193
-
194
-
195
-
196
-
197
-
198
-
199
-
200
-
201
-
202
-
203
-
204
-
205
-
206
-
207
-
208
-
209
-
210
-
211
-
212
-
213
-
214
-
215
-
216
-
217
-
218
-
219
-
220
-
221
-
222
-
223
-
224
-
225
-
226
-
227
-
228
-
229
-
230
-
231
-
232
-
233
-
234
-
235
-
236
-
237
-
238
-
239
-
240
-
241
-
242
-
243
-
244
-
245
-
246
-
247
-
248
-
249
-
250
-
251
-
252
-
253
-
254
-
255
-
256
-
257
-
258
-
259
-
260
-
261
-
262
-
263
-
264
-
265
-
266
-
267
-
268
-
269
-
270
-
271
-
272
-
273
-
274
-
275
-
276
-
277
-
278
-
279
-
280
-
281
-
282
-
283
 |
 |

Operating income decreased $3.1 billion for 2007. Operating income was primarily impacted by the
class action settlement charge, net of $2.862 billion. Revenue growth in all segments was partially offset by
lower margins in Electrical and Metal Products primarily due to unfavorable spreads on both steel and
copper products. Additionally, operating income was impacted by costs incurred relating to the Separation
and the restructuring program announced in November 2006. Separation related costs impacted operating
income by $105 million for 2007 and $49 million for 2006. Restructuring, asset impairment and divestiture
charges, net impacted operating income by $210 million and $15 million in 2007 and 2006, respectively.
Also impacting operating income was a goodwill impairment charge of $46 million due to the
reorganization into our new management and segment reporting structure. In addition, 2006 was
unfavorably affected by a $100 million charge relating to a pre-existing voluntary replacement program for
certain sprinkler heads, incremental stock option charges of $84 million as required under SFAS No. 123R,
‘‘Share-Based Payment,’’ and separation related costs of $49 million. Operating income for 2006 also
included $72 million of income related to the extinguishment of certain payment obligations under a split
dollar life insurance policy and rabbi trust pursuant to a settlement with Mr. Kozlowski, former Chief
Executive Officer, and $48 million of income resulting from a reduction in our estimated workers’
compensation liabilities primarily due to favorable claims experience.
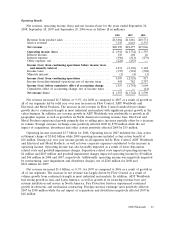
Results by Geographic Area
Net revenue by geographic area for the years ended September 26, 2008, September 28, 2007 and
September 29, 2006 was as follows ($ in millions):
2008 2007 2006
Net revenue(1):
United States ..................................... $ 9,661 $ 8,884 $ 8,617
Other Americas ................................... 1,537 1,445 1,354
Europe, Middle East and Africa ....................... 5,749 5,338 4,707
Asia-Pacific ...................................... 3,252 2,810 2,388
$20,199 $18,477 $17,066
(1) Revenue is attributed to individual countries based on the reporting entity that records the transaction.
Segment Results
The segment discussions that follow describe the significant factors contributing to the changes in
results for each of our segments included in continuing operations.
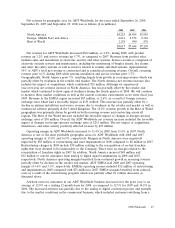
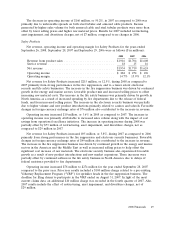
ADT Worldwide
Net revenue, operating income and operating margin for ADT Worldwide for the years ended
September 26, 2008, September 28, 2007 and September 29, 2006 were as follows ($ in millions):
2008 2007 2006
Revenue from product sales ............................. $2,821 $2,734 $2,546
Service revenue ...................................... 5,196 4,914 4,659
Net revenue ........................................ $8,017 $7,648 $7,205
Operating income .................................... $ 910 $ 842 $ 907
Operating margin ..................................... 11.4% 11.0% 12.6%
44 2008 Financials