ADT 2008 Annual Report Download - page 199
Download and view the complete annual report
Please find page 199 of the 2008 ADT annual report below. You can navigate through the pages in the report by either clicking on the pages listed below, or by using the keyword search tool below to find specific information within the annual report.-
 1
1 -
2
-
3
-
4
-
5
-
6
-
7
-
8
-
9
-
10
-
11
-
12
-
13
-
14
-
15
-
16
-
17
-
18
-
19
-
20
-
21
-
22
-
23
-
24
-
25
-
26
-
27
-
28
-
29
-
30
-
31
-
32
-
33
-
34
-
35
-
36
-
37
-
38
-
39
-
40
-
41
-
42
-
43
-
44
-
45
-
46
-
47
-
48
-
49
-
50
-
51
-
52
-
53
-
54
-
55
-
56
-
57
-
58
-
59
-
60
-
61
-
62
-
63
-
64
-
65
-
66
-
67
-
68
-
69
-
70
-
71
-
72
-
73
-
74
-
75
-
76
-
77
-
78
-
79
-
80
-
81
-
82
-
83
-
84
-
85
-
86
-
87
-
88
-
89
-
90
-
91
-
92
-
93
-
94
-
95
-
96
-
97
-
98
-
99
-
100
-
101
-
102
-
103
-
104
-
105
-
106
-
107
-
108
-
109
-
110
-
111
-
112
-
113
-
114
-
115
-
116
-
117
-
118
-
119
-
120
-
121
-
122
-
123
-
124
-
125
-
126
-
127
-
128
-
129
-
130
-
131
-
132
-
133
-
134
-
135
-
136
-
137
-
138
-
139
-
140
-
141
-
142
-
143
-
144
-
145
-
146
-
147
-
148
-
149
-
150
-
151
-
152
-
153
-
154
-
155
-
156
-
157
-
158
-
159
-
160
-
161
-
162
-
163
-
164
-
165
-
166
-
167
-
168
-
169
-
170
-
171
-
172
-
173
-
174
-
175
-
176
-
177
-
178
-
179
-
180
-
181
-
182
-
183
-
184
-
185
-
186
-
187
-
188
-
 189
189 -
 190
190 -
 191
191 -
 192
192 -
 193
193 -
 194
194 -
 195
195 -
 196
196 -
 197
197 -
 198
198 -
 199
199 -
 200
200 -
 201
201 -
 202
202 -
 203
203 -
 204
204 -
 205
205 -
 206
206 -
 207
207 -
 208
208 -
 209
209 -
210
-
211
-
212
-
213
-
214
-
215
-
216
-
217
-
218
-
219
-
220
-
221
-
222
-
223
-
224
-
225
-
226
-
227
-
228
-
229
-
230
-
231
-
232
-
233
-
234
-
235
-
236
-
237
-
238
-
239
-
240
-
241
-
242
-
243
-
244
-
245
-
246
-
247
-
248
-
249
-
250
-
251
-
252
-
253
-
254
-
255
-
256
-
257
-
258
-
259
-
260
-
261
-
262
-
263
-
264
-
265
-
266
-
267
-
268
-
269
-
270
-
271
-
272
-
273
-
274
-
275
-
276
-
277
-
278
-
279
-
280
-
281
-
282
-
283
 |
 |

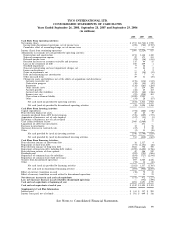
TYCO INTERNATIONAL LTD.
CONSOLIDATED STATEMENTS OF OPERATIONS
Years ended September 26, 2008, September 28, 2007 and September 29, 2006
(in millions, except per share data)
2008 2007 2006
Revenue from product sales ................................. $13,064 $11,816 $10,731
Service revenue .......................................... 7,135 6,661 6,335
Net revenue ........................................... 20,199 18,477 17,066
Cost of product sales ...................................... 9,200 8,495 7,667
Cost of services .......................................... 3,923 3,722 3,555
Selling, general and administrative expenses ...................... 4,906 4,776 4,425
Class action settlement, net of insurance recoveries ................ (10) 2,862 —
Separation costs .......................................... 4 105 49
Goodwill impairment ...................................... 9 46 —
Restructuring, asset impairment and divestiture charges, net .......... 226 203 15
Operating income (loss) .................................. 1,941 (1,732) 1,355
Interest income .......................................... 110 104 46
Interest expense .......................................... (396) (313) (279)
Other expense, net ........................................ (224) (255) —
Income (loss) from continuing operations before income taxes and
minority interest ...................................... 1,431 (2,196) 1,122
Income taxes ............................................ (335) (324) (304)
Minority interest ......................................... (1) (4) (1)
Income (loss) from continuing operations ..................... 1,095 (2,524) 817
Income from discontinued operations, net of income taxes ........... 458 782 2,787
Income (loss) before cumulative effect of accounting change ........ 1,553 (1,742) 3,604
Cumulative effect of accounting change, net of income taxes ......... — — (14)
Net income (loss) ....................................... $ 1,553 $ (1,742) $ 3,590
Basic earnings per share:
Income (loss) from continuing operations ...................... $ 2.26 $ (5.10) $ 1.63
Income from discontinued operations ......................... 0.95 1.58 5.54
Income (loss) before cumulative effect of accounting change ........ 3.21 (3.52) 7.17
Cumulative effect of accounting change ....................... — — (0.03)
Net income (loss) ....................................... $ 3.21 $ (3.52) $ 7.14
Diluted earnings per share:
Income (loss) from continuing operations ...................... $ 2.25 $ (5.10) $ 1.59
Income from discontinued operations ......................... 0.94 1.58 5.39
Income (loss) before cumulative effect of accounting change ........ 3.19 (3.52) 6.98
Cumulative effect of accounting change ....................... — — (0.03)
Net income (loss) ....................................... $ 3.19 $ (3.52) $ 6.95
Weighted-average number of shares outstanding:
Basic ................................................ 484 495 503
Diluted .............................................. 488 495 521
See Notes to Consolidated Financial Statements.
96 2008 Financials