ADT 2008 Annual Report Download - page 51
Download and view the complete annual report
Please find page 51 of the 2008 ADT annual report below. You can navigate through the pages in the report by either clicking on the pages listed below, or by using the keyword search tool below to find specific information within the annual report.-
 1
1 -
2
-
3
-
4
-
5
-
6
-
7
-
8
-
9
-
10
-
11
-
12
-
13
-
14
-
15
-
16
-
17
-
18
-
19
-
20
-
21
-
22
-
23
-
24
-
25
-
26
-
27
-
28
-
29
-
30
-
31
-
32
-
33
-
34
-
35
-
36
-
37
-
38
-
39
-
40
-
 41
41 -
 42
42 -
 43
43 -
 44
44 -
 45
45 -
 46
46 -
 47
47 -
 48
48 -
 49
49 -
 50
50 -
 51
51 -
 52
52 -
 53
53 -
 54
54 -
 55
55 -
 56
56 -
 57
57 -
 58
58 -
 59
59 -
 60
60 -
 61
61 -
62
-
63
-
64
-
65
-
66
-
67
-
68
-
69
-
70
-
71
-
72
-
73
-
74
-
75
-
76
-
77
-
78
-
79
-
80
-
81
-
82
-
83
-
84
-
85
-
86
-
87
-
88
-
89
-
90
-
91
-
92
-
93
-
94
-
95
-
96
-
97
-
98
-
99
-
100
-
101
-
102
-
103
-
104
-
105
-
106
-
107
-
108
-
109
-
110
-
111
-
112
-
113
-
114
-
115
-
116
-
117
-
118
-
119
-
120
-
121
-
122
-
123
-
124
-
125
-
126
-
127
-
128
-
129
-
130
-
131
-
132
-
133
-
134
-
135
-
136
-
137
-
138
-
139
-
140
-
141
-
142
-
143
-
144
-
145
-
146
-
147
-
148
-
149
-
150
-
151
-
152
-
153
-
154
-
155
-
156
-
157
-
158
-
159
-
160
-
161
-
162
-
163
-
164
-
165
-
166
-
167
-
168
-
169
-
170
-
171
-
172
-
173
-
174
-
175
-
176
-
177
-
178
-
179
-
180
-
181
-
182
-
183
-
184
-
185
-
186
-
187
-
188
-
189
-
190
-
191
-
192
-
193
-
194
-
195
-
196
-
197
-
198
-
199
-
200
-
201
-
202
-
203
-
204
-
205
-
206
-
207
-
208
-
209
-
210
-
211
-
212
-
213
-
214
-
215
-
216
-
217
-
218
-
219
-
220
-
221
-
222
-
223
-
224
-
225
-
226
-
227
-
228
-
229
-
230
-
231
-
232
-
233
-
234
-
235
-
236
-
237
-
238
-
239
-
240
-
241
-
242
-
243
-
244
-
245
-
246
-
247
-
248
-
249
-
250
-
251
-
252
-
253
-
254
-
255
-
256
-
257
-
258
-
259
-
260
-
261
-
262
-
263
-
264
-
265
-
266
-
267
-
268
-
269
-
270
-
271
-
272
-
273
-
274
-
275
-
276
-
277
-
278
-
279
-
280
-
281
-
282
-
283
 |
 |
Board. As discussed above, during its annual review of base salaries in fiscal 2008, the Board approved
base salary increases for Messrs. Evard and Oliver.
Annual Incentive Compensation
The annual incentive compensation, or performance bonus, for our executives is generally paid in
the form of the Annual Performance Bonus, which is an element of the Company’s 2004 Stock and
Incentive Plan (the ‘‘2004 SIP’’). However, in special circumstances, discretionary bonuses may be paid
outside the scope of the 2004 SIP. Annual incentive compensation generally takes the form of cash
bonuses for all of our Senior Officers.
Annual incentive compensation rewards the individual for his/her execution of the operating plan
and other strategic initiatives, as well as for financial performance which benefits the Company’s
business and drives long-term shareholder value creation. It places a meaningful proportion of total
cash compensation at risk, thereby aligning the pay of the executive with the Company’s financial
performance. It also offers an opportunity for meaningful pay differentiation tied to the performance of
individuals and groups.
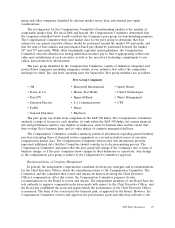
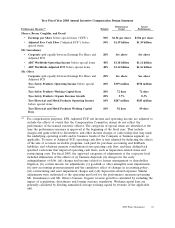
Performance measures and targets for the Company (and for each group, division and business
unit) were primarily set in the first quarter of fiscal 2008. For corporate-level employees (including
Messrs. Breen, Coughlin, and Evard), the performance measures consisted of earnings per share and
adjusted free cash flow for the entire Company. For Mr. Gursahaney, the measures consisted of ADT
Worldwide operating income and adjusted free cash flow, and earnings per share and adjusted free
cash flow for the entire company. For Mr. Oliver, the measures consisted of Tyco Safety Products
operating income, working capital days and organic revenue growth; Tyco Electrical and Metal Products
operating income and working capital days; and earnings per share and adjusted free cash flow for the
entire company. An additional measure that was applicable to all named executive officers was a
minimum performance threshold equal to 35% of targeted adjusted net income. The Committee and
the Board believe that these are the measures that result in the best alignment of management
objectives and performance with shareholder interests over time, and for this reason have established
these measures.
Threshold, target and maximum incentive compensation vary by Career Band. Target incentive
opportunities ranged from 75% to 100% of base salary for our named executive officers for fiscal 2008.
Potential payouts range from 0% to 200% of the target incentive opportunity, with discretionary
adjustments of plus or minus 25% possible for any individual award, based upon qualitative
performance measures.
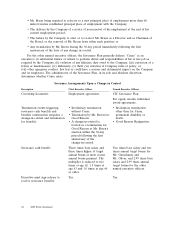
The table below summarizes the performance measures and weights used for both corporate and
non-corporate employees.
34 2009 Proxy Statement