ADT 2008 Annual Report Download - page 63
Download and view the complete annual report
Please find page 63 of the 2008 ADT annual report below. You can navigate through the pages in the report by either clicking on the pages listed below, or by using the keyword search tool below to find specific information within the annual report.-
 1
1 -
2
-
3
-
4
-
5
-
6
-
7
-
8
-
9
-
10
-
11
-
12
-
13
-
14
-
15
-
16
-
17
-
18
-
19
-
20
-
21
-
22
-
23
-
24
-
25
-
26
-
27
-
28
-
29
-
30
-
31
-
32
-
33
-
34
-
35
-
36
-
37
-
38
-
39
-
40
-
41
-
42
-
43
-
44
-
45
-
46
-
47
-
48
-
49
-
50
-
51
-
52
-
 53
53 -
 54
54 -
 55
55 -
 56
56 -
 57
57 -
 58
58 -
 59
59 -
 60
60 -
 61
61 -
 62
62 -
 63
63 -
 64
64 -
 65
65 -
 66
66 -
 67
67 -
 68
68 -
 69
69 -
 70
70 -
 71
71 -
 72
72 -
 73
73 -
74
-
75
-
76
-
77
-
78
-
79
-
80
-
81
-
82
-
83
-
84
-
85
-
86
-
87
-
88
-
89
-
90
-
91
-
92
-
93
-
94
-
95
-
96
-
97
-
98
-
99
-
100
-
101
-
102
-
103
-
104
-
105
-
106
-
107
-
108
-
109
-
110
-
111
-
112
-
113
-
114
-
115
-
116
-
117
-
118
-
119
-
120
-
121
-
122
-
123
-
124
-
125
-
126
-
127
-
128
-
129
-
130
-
131
-
132
-
133
-
134
-
135
-
136
-
137
-
138
-
139
-
140
-
141
-
142
-
143
-
144
-
145
-
146
-
147
-
148
-
149
-
150
-
151
-
152
-
153
-
154
-
155
-
156
-
157
-
158
-
159
-
160
-
161
-
162
-
163
-
164
-
165
-
166
-
167
-
168
-
169
-
170
-
171
-
172
-
173
-
174
-
175
-
176
-
177
-
178
-
179
-
180
-
181
-
182
-
183
-
184
-
185
-
186
-
187
-
188
-
189
-
190
-
191
-
192
-
193
-
194
-
195
-
196
-
197
-
198
-
199
-
200
-
201
-
202
-
203
-
204
-
205
-
206
-
207
-
208
-
209
-
210
-
211
-
212
-
213
-
214
-
215
-
216
-
217
-
218
-
219
-
220
-
221
-
222
-
223
-
224
-
225
-
226
-
227
-
228
-
229
-
230
-
231
-
232
-
233
-
234
-
235
-
236
-
237
-
238
-
239
-
240
-
241
-
242
-
243
-
244
-
245
-
246
-
247
-
248
-
249
-
250
-
251
-
252
-
253
-
254
-
255
-
256
-
257
-
258
-
259
-
260
-
261
-
262
-
263
-
264
-
265
-
266
-
267
-
268
-
269
-
270
-
271
-
272
-
273
-
274
-
275
-
276
-
277
-
278
-
279
-
280
-
281
-
282
-
283
 |
 |

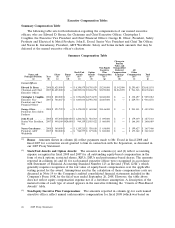
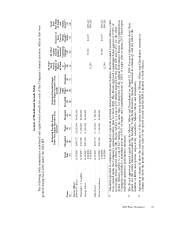
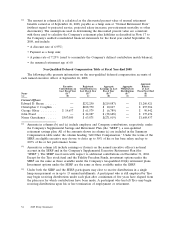
Executive Compensation Tables
Summary Compensation Table
The following table sets forth information regarding the compensation of our named executive
officers, who are Edward D. Breen, the Chairman and Chief Executive Officer; Christopher J.
Coughlin, the Executive Vice President and Chief Financial Officer; George R. Oliver, President, Safety
Products and Electrical & Metal Products; John E. Evard, Senior Vice President and Chief Tax Officer;
and Naren K. Gursahaney, President, ADT Worldwide. Salary and bonus include amounts that may be
deferred at the named executive officer’s election.
Summary Compensation Table
Change in
Pension
Value and
Non-Equity Nonqualified
Incentive Deferred All
Stock/Unit Option Plan Compensation Other
Name and Salary Bonus Awards Awards Compensation Earnings Compensation Total
Principal Position Year ($) ($)(1) ($)(2) ($)(2) ($)(3) ($)(4) ($)(5) ($)
(a) (b) (c) (d) (e) (f) (g) (h) (i) (j)
Current Officers
Edward D. Breen ....2008 $1,625,000 $ — $ 8,198,879 $4,705,629 $3,250,000 $1,542,000 $1,293,683 $20,615,191
Chairman and Chief 2007 $1,625,000 $ — $10,505,034 $7,186,796 $3,250,000 $1,263,270 $ 911,518 $24,741,618
Executive Officer
Christopher J. Coughlin . 2008 $ 800,000 $ — $ 3,591,691 $2,731,195 $1,600,000 $ — $ 332,197 $ 9,055,083
Executive Vice 2007 $ 766,667 $ — $ 3,805,034 $2,956,702 $1,605,000 $ — $ 229,753 $ 9,363,156
President and Chief
Financial Officer
George Oliver ......2008 $ 593,739 $ — $ 1,478,055 $ 601,060 $1,146,000 $ — $ 213,111 $ 4,031,965
President, Tyco Safety
Products
John Evard .......2008 $ 455,040 $420,000 $ 1,206,561 $ 924,303 $ 690,000 $ — $ 179,439 $ 3,875,343
Senior Vice President, 2007 $ 440,160 $420,000 $ 964,359 $1,035,422 $ 660,000 $ — $ 166,148 $ 3,686,089
Ta x
Naren Gursahaney . . . 2008 $ 560,000 $ — $ 1,339,215 $ 920,618 $ 638,000 $ — $ 199,627 $ 3,657,460
President, ADT 2007 $ 520,000 $ — $ 962,577 $ 877,226 $ 880,000 $ — $ 175,362 $ 3,415,165
Worldwide
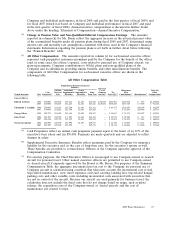
(1) Bonus: Amounts shown in column (d) reflect payments made to Mr. Evard in fiscal 2008 and
fiscal 2007 for a retention award granted to him in connection with the Separation, as discussed in
our 2007 Proxy Statement.
(2) Stock/Unit Awards and Option Awards: The amounts in columns (e) and (f) reflect accounting
expense recognized in fiscal 2008 and 2007 for all outstanding equity-based compensation in the
form of stock options, restricted shares, RSUs, DSUs and performance-based shares. The amounts
reported in columns (e) and (f) for each named executive officer were recognized in accordance
with Statement of Financial Accounting Standard Number 123 as Revised (‘‘FAS 123R’’), which
generally requires recognition of the fair value of equity-based compensation over the applicable
vesting period for the award. Assumptions used in the calculation of these compensation costs are
discussed in Note 19 to the Company’s audited consolidated financial statements included in the
Company’s Form 10-K for the fiscal year ended September 26, 2008. However, the table above
does not reflect equity compensation expense net of a forfeiture assumption. A description of the
material terms of each type of award appears in the narrative following the ‘‘Grants of Plan-Based
Awards’’ table.
(3) Non-Equity Incentive Plan Compensation: The amounts reported in column (g) for each named
executive officer reflect annual cash incentive compensation for fiscal 2008 (which was based on
46 2009 Proxy Statement