ADT 2008 Annual Report Download - page 282
Download and view the complete annual report
Please find page 282 of the 2008 ADT annual report below. You can navigate through the pages in the report by either clicking on the pages listed below, or by using the keyword search tool below to find specific information within the annual report.-
 1
1 -
2
-
3
-
4
-
5
-
6
-
7
-
8
-
9
-
10
-
11
-
12
-
13
-
14
-
15
-
16
-
17
-
18
-
19
-
20
-
21
-
22
-
23
-
24
-
25
-
26
-
27
-
28
-
29
-
30
-
31
-
32
-
33
-
34
-
35
-
36
-
37
-
38
-
39
-
40
-
41
-
42
-
43
-
44
-
45
-
46
-
47
-
48
-
49
-
50
-
51
-
52
-
53
-
54
-
55
-
56
-
57
-
58
-
59
-
60
-
61
-
62
-
63
-
64
-
65
-
66
-
67
-
68
-
69
-
70
-
71
-
72
-
73
-
74
-
75
-
76
-
77
-
78
-
79
-
80
-
81
-
82
-
83
-
84
-
85
-
86
-
87
-
88
-
89
-
90
-
91
-
92
-
93
-
94
-
95
-
96
-
97
-
98
-
99
-
100
-
101
-
102
-
103
-
104
-
105
-
106
-
107
-
108
-
109
-
110
-
111
-
112
-
113
-
114
-
115
-
116
-
117
-
118
-
119
-
120
-
121
-
122
-
123
-
124
-
125
-
126
-
127
-
128
-
129
-
130
-
131
-
132
-
133
-
134
-
135
-
136
-
137
-
138
-
139
-
140
-
141
-
142
-
143
-
144
-
145
-
146
-
147
-
148
-
149
-
150
-
151
-
152
-
153
-
154
-
155
-
156
-
157
-
158
-
159
-
160
-
161
-
162
-
163
-
164
-
165
-
166
-
167
-
168
-
169
-
170
-
171
-
172
-
173
-
174
-
175
-
176
-
177
-
178
-
179
-
180
-
181
-
182
-
183
-
184
-
185
-
186
-
187
-
188
-
189
-
190
-
191
-
192
-
193
-
194
-
195
-
196
-
197
-
198
-
199
-
200
-
201
-
202
-
203
-
204
-
205
-
206
-
207
-
208
-
209
-
210
-
211
-
212
-
213
-
214
-
215
-
216
-
217
-
218
-
219
-
220
-
221
-
222
-
223
-
224
-
225
-
226
-
227
-
228
-
229
-
230
-
231
-
232
-
233
-
234
-
235
-
236
-
237
-
238
-
239
-
240
-
241
-
242
-
243
-
244
-
245
-
246
-
247
-
248
-
249
-
250
-
251
-
252
-
253
-
254
-
255
-
256
-
257
-
258
-
259
-
260
-
261
-
262
-
263
-
264
-
265
-
266
-
267
-
268
-
269
-
270
-
271
-
 272
272 -
 273
273 -
 274
274 -
 275
275 -
 276
276 -
 277
277 -
 278
278 -
 279
279 -
 280
280 -
 281
281 -
 282
282 -
 283
283
 |
 |

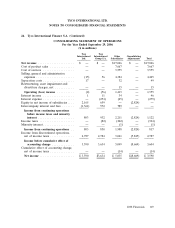
2006 INCOME FROM CONTINUING OPERATIONS BEFORE SPECIAL ITEMS
DILUTED
INCOME FROM EPS FROM
OPERATING INTEREST OTHER INCOME MINORITY CONTINUING CONTINUING
( IN US$ MILLIONS, EXCEPT PER SHARE DATA ) INCOME EXPENSE, NET EXPENSE, NET TAXES INTEREST OPERATIONS OPERATIONS
OPERATING INCOME ( LOSS ) $ 1,355 $ ( 233 ) — $ ( 304 ) $ ( 1 ) $ 817 $ 1.59
Separation costs 49 ( 10 ) 39 0.07
Losses on divestitures 2 2 0.01
Reduction in estimated workers’ compensation liabilities ( 48 ) 18 ( 30 ) ( 0.06 )
Voluntary replacement program 100 ( 38 ) 62 0.12
Former management settlement ( 72 ) ( 72 ) ( 0.14 )
OPERATING INCOME ( LOSS ) BEFORE SPECIAL ITEMS $ 1,386 $ ( 233 ) — $ ( 334 ) $ ( 1 ) $ 818 $ 1.59
2007 INCOME FROM CONTINUING OPERATIONS BEFORE SPECIAL ITEMS
DILUTE
INCOME FROM EPS FROM
OPERATING INTEREST OTHER INCOME MINORITY CONTINUING CONTINUING
( IN US$ MILLIONS, EXCEPT PER SHARE DATA ) INCOME EXPENSE, NET EXPENSE, NET TAXES INTEREST OPERATIONS OPERATIONS
OPERATING INCOME ( LOSS ) $ ( 1,732 ) $ ( 209 ) $ ( 255 ) $ ( 324 ) $ ( 4 ) $ ( 2,524 ) $ ( 5.10 )
Restructuring charges in cost of sales and SG&A 7 ( 1 ) 6 0.01
Class-action settlement, net* 2,871 2,871 5.81
Separation and related costs** 118 259 92 469 0.93
Losses on divestitures 4 ( 1 ) 3 —
Restructuring and asset impairment charges, net 199 ( 66 ) 133 0.26
Goodwill impairment 46 46 0.09
Tax items ( 63 ) ( 63 ) ( 0.12 )
Voluntary replacement program 10 ( 3 ) 7 0.01
OPERATING INCOME ( LOSS ) BEFORE SPECIAL ITEMS $ 1,523 $ ( 209 ) $ 4 $ ( 366 ) $ ( 4 ) $ 948 $ 1.89
* Includes $9 million of costs included in selling, general and administrative expenses (SG&A).
** Includes $13 million of charges related to the accelerated vesting of restricted shares in connection with the separation. These charges are included in SG&A.
2008 INCOME FROM CONTINUING OPERATIONS BEFORE SPECIAL ITEMS
DILUTED
INCOME FROM EPS FROM
OPERATING INTEREST OTHER INCOME MINORITY CONTINUING CONTINUING
( IN US$ MILLIONS, EXCEPT PER SHARE DATA ) INCOME EXPENSE, NET EXPENSE, NET TAXES INTEREST OPERATIONS OPERATIONS
OPERATING INCOME ( LOSS ) $ 1,941 $ ( 286 ) $ ( 224 ) $ ( 335 ) $ ( 1 ) $ 1,095 $ 2.25
Restructuring charges in cost of sales and SG&A 28 ( 6 ) 22 0.04
Class-action settlement, net ( 10 ) ( 10 ) ( 0.02 )
Separation costs 5 47 225 ( 102 ) 175 0.36
Losses on divestitures 1 1 —
Restructuring and asset impairment charges, net 225 ( 65 ) 160 0.33
Goodwill impairment 9 9 0.02
Tax items 21 21 0.04
Reserve adjustment ( 9 ) ( 9 ) ( 0.02 )
Legacy legal settlement 29 29 0.06
OPERATING INCOME ( LOSS ) BEFORE SPECIAL ITEMS $ 2,219 $ ( 239 ) $ 1 $ ( 487 ) $ ( 1 ) $ 1,493 $ 3.06