ADT 2008 Annual Report Download - page 150
Download and view the complete annual report
Please find page 150 of the 2008 ADT annual report below. You can navigate through the pages in the report by either clicking on the pages listed below, or by using the keyword search tool below to find specific information within the annual report.-
 1
1 -
2
-
3
-
4
-
5
-
6
-
7
-
8
-
9
-
10
-
11
-
12
-
13
-
14
-
15
-
16
-
17
-
18
-
19
-
20
-
21
-
22
-
23
-
24
-
25
-
26
-
27
-
28
-
29
-
30
-
31
-
32
-
33
-
34
-
35
-
36
-
37
-
38
-
39
-
40
-
41
-
42
-
43
-
44
-
45
-
46
-
47
-
48
-
49
-
50
-
51
-
52
-
53
-
54
-
55
-
56
-
57
-
58
-
59
-
60
-
61
-
62
-
63
-
64
-
65
-
66
-
67
-
68
-
69
-
70
-
71
-
72
-
73
-
74
-
75
-
76
-
77
-
78
-
79
-
80
-
81
-
82
-
83
-
84
-
85
-
86
-
87
-
88
-
89
-
90
-
91
-
92
-
93
-
94
-
95
-
96
-
97
-
98
-
99
-
100
-
101
-
102
-
103
-
104
-
105
-
106
-
107
-
108
-
109
-
110
-
111
-
112
-
113
-
114
-
115
-
116
-
117
-
118
-
119
-
120
-
121
-
122
-
123
-
124
-
125
-
126
-
127
-
128
-
129
-
130
-
131
-
132
-
133
-
134
-
135
-
136
-
137
-
138
-
139
-
 140
140 -
 141
141 -
 142
142 -
 143
143 -
 144
144 -
 145
145 -
 146
146 -
 147
147 -
 148
148 -
 149
149 -
 150
150 -
 151
151 -
 152
152 -
 153
153 -
 154
154 -
 155
155 -
 156
156 -
 157
157 -
 158
158 -
 159
159 -
 160
160 -
161
-
162
-
163
-
164
-
165
-
166
-
167
-
168
-
169
-
170
-
171
-
172
-
173
-
174
-
175
-
176
-
177
-
178
-
179
-
180
-
181
-
182
-
183
-
184
-
185
-
186
-
187
-
188
-
189
-
190
-
191
-
192
-
193
-
194
-
195
-
196
-
197
-
198
-
199
-
200
-
201
-
202
-
203
-
204
-
205
-
206
-
207
-
208
-
209
-
210
-
211
-
212
-
213
-
214
-
215
-
216
-
217
-
218
-
219
-
220
-
221
-
222
-
223
-
224
-
225
-
226
-
227
-
228
-
229
-
230
-
231
-
232
-
233
-
234
-
235
-
236
-
237
-
238
-
239
-
240
-
241
-
242
-
243
-
244
-
245
-
246
-
247
-
248
-
249
-
250
-
251
-
252
-
253
-
254
-
255
-
256
-
257
-
258
-
259
-
260
-
261
-
262
-
263
-
264
-
265
-
266
-
267
-
268
-
269
-
270
-
271
-
272
-
273
-
274
-
275
-
276
-
277
-
278
-
279
-
280
-
281
-
282
-
283
 |
 |

primarily driven by continued project growth in the oil and gas industry while the thermal business
benefited primarily from continued strong project growth coupled with increased selling prices. While
revenue within the water business increased year over year, project activity declined during the second
half of 2008, primarily in Australia. Favorable changes in foreign currency exchange rates positively
impacted revenue by $314 million. The net impact of acquisitions, divestitures and other activity
positively affected revenue by $6 million.
Operating income increased $161 million, or 35.2%, in 2008 as compared to 2007 primarily from
revenue growth, as well as volume efficiencies. Flow Control incurred restructuring, asset impairment
and divestiture charges, net of $8 million, compared to $28 million in 2007. Additionally, selling,
general and administrative expenses in 2008 included an environmental remediation charge of
$6 million related to the closure of a facility in North America as compared to no charges in 2007.
Net revenue for Flow Control increased $631 million, or 20.1%, in 2007 as compared to 2006. The
increase in net revenue was largely driven by volume growth from continued strength in most industrial
end markets with significant project growth in the energy and water sectors. Growth in these sectors
was strong across all geographical regions, and, in particular, Asia-Pacific and Europe. Favorable
changes in foreign currency exchange rates positively impacted revenue by $197 million while the net
impact of acquisitions and divestitures unfavorably impacted net revenue by $16 million.
The increase in operating income of $101 million, or 28.4%, in 2007 as compared 2006 was
primarily due to revenue growth, as well as improved utilization rates. The increase in operating
income during 2007 was partially offset by restructuring, asset impairment and divestiture charges, net
of $28 million, which includes $6 million in cost of sales and selling, general and administrative
expenses.
Fire Protection Services
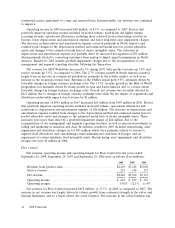
Net revenue, operating income and operating margin for Fire Protection Services for the years
ended September 26, 2008, September 28, 2007 and September 29, 2006 were as follows ($ in millions):
2008 2007 2006
Revenue from product sales ............................. $1,860 $1,790 $1,629
Service revenue ...................................... 1,693 1,576 1,521
Net revenue ........................................ $3,553 $3,366 $3,150
Operating income .................................... $ 321 $ 258 $ 241
Operating margin ..................................... 9.0% 7.7% 7.7%
Net revenue for Fire Protection Services increased $187 million, or 5.6%, during 2008 as compared
to 2007, driven by increases in both product sales and service revenues. Revenue from product sales
includes sales and installation of fire protection and other systems. Service revenue comprises of
inspection, maintenance, service and monitoring of fire detection and suppression systems. This
increase in product sales was aided by foreign currency exchange rates, which had a favorable impact of
$63 million. The increase in service revenue related to growth in service work and sprinkler contracting
in North America and Asia primarily as a result of an increase in demand from the education and
healthcare industries in North America and continued commercial expansion in the Asia Pacific region.
Additionally, changes in foreign currency exchange rates had a favorable impact of $62 million on
service revenue. The increase was partially offset by reduced revenue in EMEA and Australia/New
Zealand primarily due to a decline in contracting revenue as a result of a strategic initiative to be more
selective in our pursuit of contracts. Additionally, the net revenue increase was partially offset due to
the planned exit of low performing non-core activities in Latin America and Asia. Overall, the Fire
Protection Services net revenue increase included the favorable impact of changes in foreign currency
exchange rates of $125 million.
2008 Financials 47