ADT 2008 Annual Report Download - page 66
Download and view the complete annual report
Please find page 66 of the 2008 ADT annual report below. You can navigate through the pages in the report by either clicking on the pages listed below, or by using the keyword search tool below to find specific information within the annual report.-
 1
1 -
2
-
3
-
4
-
5
-
6
-
7
-
8
-
9
-
10
-
11
-
12
-
13
-
14
-
15
-
16
-
17
-
18
-
19
-
20
-
21
-
22
-
23
-
24
-
25
-
26
-
27
-
28
-
29
-
30
-
31
-
32
-
33
-
34
-
35
-
36
-
37
-
38
-
39
-
40
-
41
-
42
-
43
-
44
-
45
-
46
-
47
-
48
-
49
-
50
-
51
-
52
-
53
-
54
-
55
-
 56
56 -
 57
57 -
 58
58 -
 59
59 -
 60
60 -
 61
61 -
 62
62 -
 63
63 -
 64
64 -
 65
65 -
 66
66 -
 67
67 -
 68
68 -
 69
69 -
 70
70 -
 71
71 -
 72
72 -
 73
73 -
 74
74 -
 75
75 -
 76
76 -
77
-
78
-
79
-
80
-
81
-
82
-
83
-
84
-
85
-
86
-
87
-
88
-
89
-
90
-
91
-
92
-
93
-
94
-
95
-
96
-
97
-
98
-
99
-
100
-
101
-
102
-
103
-
104
-
105
-
106
-
107
-
108
-
109
-
110
-
111
-
112
-
113
-
114
-
115
-
116
-
117
-
118
-
119
-
120
-
121
-
122
-
123
-
124
-
125
-
126
-
127
-
128
-
129
-
130
-
131
-
132
-
133
-
134
-
135
-
136
-
137
-
138
-
139
-
140
-
141
-
142
-
143
-
144
-
145
-
146
-
147
-
148
-
149
-
150
-
151
-
152
-
153
-
154
-
155
-
156
-
157
-
158
-
159
-
160
-
161
-
162
-
163
-
164
-
165
-
166
-
167
-
168
-
169
-
170
-
171
-
172
-
173
-
174
-
175
-
176
-
177
-
178
-
179
-
180
-
181
-
182
-
183
-
184
-
185
-
186
-
187
-
188
-
189
-
190
-
191
-
192
-
193
-
194
-
195
-
196
-
197
-
198
-
199
-
200
-
201
-
202
-
203
-
204
-
205
-
206
-
207
-
208
-
209
-
210
-
211
-
212
-
213
-
214
-
215
-
216
-
217
-
218
-
219
-
220
-
221
-
222
-
223
-
224
-
225
-
226
-
227
-
228
-
229
-
230
-
231
-
232
-
233
-
234
-
235
-
236
-
237
-
238
-
239
-
240
-
241
-
242
-
243
-
244
-
245
-
246
-
247
-
248
-
249
-
250
-
251
-
252
-
253
-
254
-
255
-
256
-
257
-
258
-
259
-
260
-
261
-
262
-
263
-
264
-
265
-
266
-
267
-
268
-
269
-
270
-
271
-
272
-
273
-
274
-
275
-
276
-
277
-
278
-
279
-
280
-
281
-
282
-
283
 |
 |

2009 Proxy Statement 49
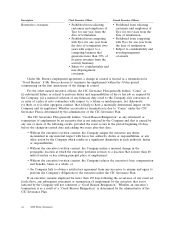
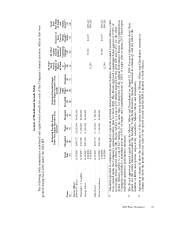
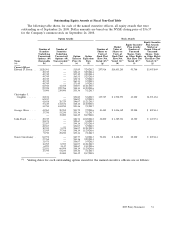
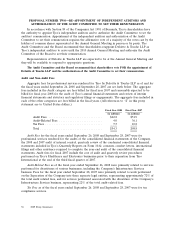
Grants of Plan-Based Awards Table
The following table summarizes cash-based and equity-based awards for each of the Company’s named executive officers that were
granted during fiscal 2008 under the 2004 SIP.
All Other
Stock All Other Grant
Estimated Possible Payouts Estimated Possible Payouts Awards: Option Date
Under Non-Equity Incentive Plan Under Equity Incentive Plan Number of Awards: Exercise or Fair Value
Awards(1) Awards Shares Number of Base of Stock
Target of Stock Securities Price of and
(Mid- or Underlying Option Option
Grant Threshold Target Maximum Threshold Point) Maximum Units(2) Options(2) Awards(3) Awards(3)
Name Date ($) ($) ($) ($) ($) ($) (#) (#) ($/Sh) ($)
(a) (b) (d) (e) (f) (g) (h) (i) (j) (k) (l) (m)
Current Officers
Edward D. Breen .......... 11/19/2007 $609,375 $1,625,000 $4,062,500
Christopher J. Coughlin ...... 11/19/2007 $300,000 $ 800,000 $2,000,000
George Oliver ............ 11/19/2007 $225,000 $ 600,000 $1,500,000
8/18/2008 35,000 $44.49 $458,112
8/18/2008 11,200 $498,288
John Evard .............. 11/19/2007 $129,375 $ 345,000 $ 862,500
Naren Gursahaney ......... 11/19/2007 $210,000 $ 560,000 $1,400,000
8/18/2008 35,000 $44.49 $458,112
8/18/2008 11,200 $498,288
(1) Amounts reported in columns (d) through (f) represent potential annual performance bonuses that the named executive officers could
have earned under the Company’s annual incentive plan for fiscal 2008. The Board approved a maximum bonus payout of 0.50% of
net income before special items for Mr. Breen, subject to a cap of $5.0 million imposed by the 2004 SIP, and 0.25% for the other
Senior Officers, subject to a cap of $2.5 million. At the same time, for purposes of the Annual Performance Bonus, the Compensation
Committee established a minimum payout of 50% of target and a maximum payout of 200% of target, plus or minus 25% based upon
individual qualitative performance measures.
(2) The Board approved special equity grants for Messrs. Oliver and Gursahaney on August 18, 2008. For more information about these
grants, see the earlier discussion under the heading ‘‘Long Term Incentive Awards.’’ Amounts in columns (j) and (k) reflect the
number of RSUs and options, respectively, awarded to Messrs. Oliver and Gursahaney.
(3) Amounts in column (l) show the exercise price of the option awards granted to Messrs. Oliver and Gursahaney; amounts in
column (m) show the grant-date fair value of the option awards and the RSUs granted to both officers.