ADT 2008 Annual Report Download - page 269
Download and view the complete annual report
Please find page 269 of the 2008 ADT annual report below. You can navigate through the pages in the report by either clicking on the pages listed below, or by using the keyword search tool below to find specific information within the annual report.-
 1
1 -
2
-
3
-
4
-
5
-
6
-
7
-
8
-
9
-
10
-
11
-
12
-
13
-
14
-
15
-
16
-
17
-
18
-
19
-
20
-
21
-
22
-
23
-
24
-
25
-
26
-
27
-
28
-
29
-
30
-
31
-
32
-
33
-
34
-
35
-
36
-
37
-
38
-
39
-
40
-
41
-
42
-
43
-
44
-
45
-
46
-
47
-
48
-
49
-
50
-
51
-
52
-
53
-
54
-
55
-
56
-
57
-
58
-
59
-
60
-
61
-
62
-
63
-
64
-
65
-
66
-
67
-
68
-
69
-
70
-
71
-
72
-
73
-
74
-
75
-
76
-
77
-
78
-
79
-
80
-
81
-
82
-
83
-
84
-
85
-
86
-
87
-
88
-
89
-
90
-
91
-
92
-
93
-
94
-
95
-
96
-
97
-
98
-
99
-
100
-
101
-
102
-
103
-
104
-
105
-
106
-
107
-
108
-
109
-
110
-
111
-
112
-
113
-
114
-
115
-
116
-
117
-
118
-
119
-
120
-
121
-
122
-
123
-
124
-
125
-
126
-
127
-
128
-
129
-
130
-
131
-
132
-
133
-
134
-
135
-
136
-
137
-
138
-
139
-
140
-
141
-
142
-
143
-
144
-
145
-
146
-
147
-
148
-
149
-
150
-
151
-
152
-
153
-
154
-
155
-
156
-
157
-
158
-
159
-
160
-
161
-
162
-
163
-
164
-
165
-
166
-
167
-
168
-
169
-
170
-
171
-
172
-
173
-
174
-
175
-
176
-
177
-
178
-
179
-
180
-
181
-
182
-
183
-
184
-
185
-
186
-
187
-
188
-
189
-
190
-
191
-
192
-
193
-
194
-
195
-
196
-
197
-
198
-
199
-
200
-
201
-
202
-
203
-
204
-
205
-
206
-
207
-
208
-
209
-
210
-
211
-
212
-
213
-
214
-
215
-
216
-
217
-
218
-
219
-
220
-
221
-
222
-
223
-
224
-
225
-
226
-
227
-
228
-
229
-
230
-
231
-
232
-
233
-
234
-
235
-
236
-
237
-
238
-
239
-
240
-
241
-
242
-
243
-
244
-
245
-
246
-
247
-
248
-
249
-
250
-
251
-
252
-
253
-
254
-
255
-
256
-
257
-
258
-
 259
259 -
 260
260 -
 261
261 -
 262
262 -
 263
263 -
 264
264 -
 265
265 -
 266
266 -
 267
267 -
 268
268 -
 269
269 -
 270
270 -
 271
271 -
 272
272 -
 273
273 -
 274
274 -
 275
275 -
 276
276 -
 277
277 -
 278
278 -
 279
279 -
280
-
281
-
282
-
283
 |
 |

TYCO INTERNATIONAL LTD.
NOTES TO CONSOLIDATED FINANCIAL STATEMENTS
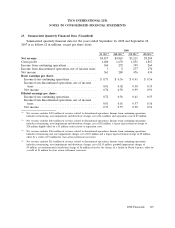
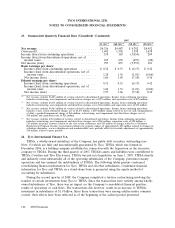
23. Summarized Quarterly Financial Data (Unaudited) (Continued)
2007
1st Qtr.(1) 2nd Qtr.(2) 3rd Qtr.(3) 4th Qtr.(4)
Net revenue .................................. $4,336 $4,487 $ 4,702 $4,952
Gross profit .................................. 1,482 1,502 1,598 1,678
Income (loss) from continuing operations ............ 158 163 (3,054) 209
Income (loss) from discontinued operations, net of
income taxes ............................... 635 672 (497) (28)
Net income (loss) ............................. 793 835 (3,551) 181
Basic earnings per share:
Income (loss) from continuing operations .......... $ 0.32 $ 0.33 $ (6.17) $ 0.42
Income (loss) from discontinued operations, net of
income taxes .............................. 1.28 1.36 (1.01) (0.06)
Net income (loss) ............................ 1.60 1.69 (7.18) 0.36
Diluted earnings per share:
Income (loss) from continuing operations .......... 0.31 0.33 (6.17) 0.42
Income (loss) from discontinued operations, net of
income taxes .............................. 1.26 1.33 (1.01) (0.06)
Net income (loss) ............................ 1.57 1.66 (7.18) 0.36
(1) Net revenue excludes $6,023 million of revenue related to discontinued operations. Income from continuing operations
includes restructuring, asset impairment and divestiture charges net, of $57 million, and separation costs of $25 million.
(2) Net revenue excludes $6,351 million of revenue related to discontinued operations. Income from continuing operations
includes restructuring, asset impairment and divestiture charges, net of $46 million and separation costs of $32 million.
(3) Net revenue excludes $6,465 million of revenue related to discontinued operations. Income from continuing operations
includes a class action settlement charge, net of $2.875 billion, a $259 million charge related to loss on early extinguishment
of debt, a goodwill impairment charge of $46 million, restructuring, asset impairment and divestiture charges, net of
$48 million and separation costs of $28 million.
(4) Net revenue excludes $432 million of revenue related to discontinued operations. Income from continuing operations
includes restructuring, asset impairment and divestiture charges, net of $60 million, separation costs of $20 million, a
$13 million insurance recovery related to the class action settlement, and $10 million of charges related to a Voluntary
Replacement Program. Income tax provision includes the negative impact of approximately $58 million related to changes in
valuation allowances, reserve adjustments and nondeductible costs, partially offset by favorable adjustments of approximately
$48 million related to prior periods.
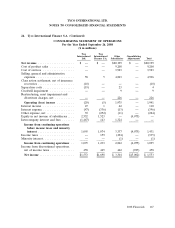
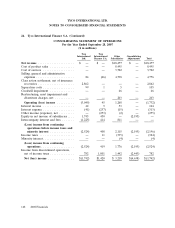
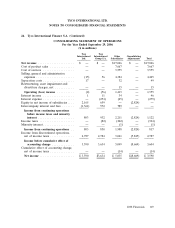
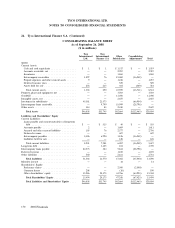
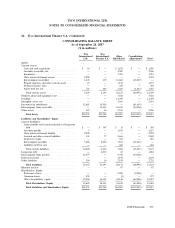
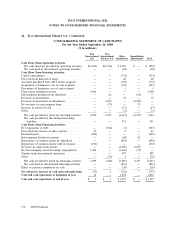
24. Tyco International Finance S.A.
TIFSA, a wholly-owned subsidiary of the Company, has public debt securities outstanding (see
Note 13) which are fully and unconditionally guaranteed by Tyco. TIFSA, which was formed in
December 2006, is a holding company established in connection with the Separation as the successor
company to TIGSA. During the third quarter of 2007, TIGSA’s assets and liabilities were contributed to
TIFSA, Covidien and Tyco Electronics. TIGSA was put into liquidation on June 1, 2007. TIFSA directly
and indirectly owns substantially all of the operating subsidiaries of the Company, performs treasury
operations and has assumed the indebtedness of TIGSA. The following tables present condensed
consolidating financial information for Tyco, TIFSA and all other subsidiaries. Condensed financial
information for Tyco and TIFSA on a stand-alone basis is presented using the equity method of
accounting for subsidiaries.
During the second quarter of 2008, the Company completed a tax-free restructuring involving the
transfer of certain investments from Tyco to TIFSA. Since the transactions were entirely among wholly-
owned subsidiaries of Tyco, there was no impact on the Company’s consolidated financial position,
results of operations or cash flows. The transactions did, however, result in an increase to TIFSA’s
investment in subsidiaries of $1.9 billion. Since these transactions were among entities under common
control, their effects have been reflected as of the beginning of the earliest period presented.
166 2008 Financials