ADT 2008 Annual Report Download - page 262
Download and view the complete annual report
Please find page 262 of the 2008 ADT annual report below. You can navigate through the pages in the report by either clicking on the pages listed below, or by using the keyword search tool below to find specific information within the annual report.-
 1
1 -
2
-
3
-
4
-
5
-
6
-
7
-
8
-
9
-
10
-
11
-
12
-
13
-
14
-
15
-
16
-
17
-
18
-
19
-
20
-
21
-
22
-
23
-
24
-
25
-
26
-
27
-
28
-
29
-
30
-
31
-
32
-
33
-
34
-
35
-
36
-
37
-
38
-
39
-
40
-
41
-
42
-
43
-
44
-
45
-
46
-
47
-
48
-
49
-
50
-
51
-
52
-
53
-
54
-
55
-
56
-
57
-
58
-
59
-
60
-
61
-
62
-
63
-
64
-
65
-
66
-
67
-
68
-
69
-
70
-
71
-
72
-
73
-
74
-
75
-
76
-
77
-
78
-
79
-
80
-
81
-
82
-
83
-
84
-
85
-
86
-
87
-
88
-
89
-
90
-
91
-
92
-
93
-
94
-
95
-
96
-
97
-
98
-
99
-
100
-
101
-
102
-
103
-
104
-
105
-
106
-
107
-
108
-
109
-
110
-
111
-
112
-
113
-
114
-
115
-
116
-
117
-
118
-
119
-
120
-
121
-
122
-
123
-
124
-
125
-
126
-
127
-
128
-
129
-
130
-
131
-
132
-
133
-
134
-
135
-
136
-
137
-
138
-
139
-
140
-
141
-
142
-
143
-
144
-
145
-
146
-
147
-
148
-
149
-
150
-
151
-
152
-
153
-
154
-
155
-
156
-
157
-
158
-
159
-
160
-
161
-
162
-
163
-
164
-
165
-
166
-
167
-
168
-
169
-
170
-
171
-
172
-
173
-
174
-
175
-
176
-
177
-
178
-
179
-
180
-
181
-
182
-
183
-
184
-
185
-
186
-
187
-
188
-
189
-
190
-
191
-
192
-
193
-
194
-
195
-
196
-
197
-
198
-
199
-
200
-
201
-
202
-
203
-
204
-
205
-
206
-
207
-
208
-
209
-
210
-
211
-
212
-
213
-
214
-
215
-
216
-
217
-
218
-
219
-
220
-
221
-
222
-
223
-
224
-
225
-
226
-
227
-
228
-
229
-
230
-
231
-
232
-
233
-
234
-
235
-
236
-
237
-
238
-
239
-
240
-
241
-
242
-
243
-
244
-
245
-
246
-
247
-
248
-
249
-
250
-
251
-
 252
252 -
 253
253 -
 254
254 -
 255
255 -
 256
256 -
 257
257 -
 258
258 -
 259
259 -
 260
260 -
 261
261 -
 262
262 -
 263
263 -
 264
264 -
 265
265 -
 266
266 -
 267
267 -
 268
268 -
 269
269 -
 270
270 -
 271
271 -
 272
272 -
273
-
274
-
275
-
276
-
277
-
278
-
279
-
280
-
281
-
282
-
283
 |
 |

TYCO INTERNATIONAL LTD.
NOTES TO CONSOLIDATED FINANCIAL STATEMENTS
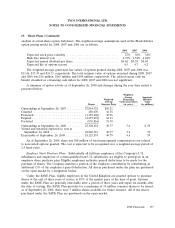
19. Share Plans (Continued)
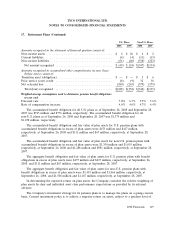
A summary of the status of the Company’s restricted share awards including performance shares as
of September 26, 2008 and changes during the year then ended is presented in the tables below:
Weighted-Average
Grant-Date Fair
Non-vested Restricted Share Awards Shares Value
Non-vested at September 28, 2007 .............................. 4,515,154 $49.83
Granted ................................................. 320,488 40.27
Vested .................................................. (830,795) 49.84
Forfeited ................................................ (502,601) 49.83
Non-vested at September 26, 2008 .............................. 3,502,246 49.06
The weighted-average grant-date fair value of restricted share awards granted during 2008, 2007
and 2006 was $40.27, $49.49 and $45.37, respectively. The total fair value of restricted share awards
vested during 2008, 2007 and 2006 was $41 million, $58 million and $26 million, respectively.
Weighted-Average
Grant-Date Fair
Non-vested Performance Share Awards Shares Value
Non-vested at September 28, 2007 ............................... 531,310 $61.90
Granted .................................................. 3,730 46.11
Forfeited .................................................. (51,990) 61.90
Non-vested at September 26, 2008 ............................... 483,050 61.78
The weighted-average grant-date fair value of performance share awards granted during 2008, 2007
and 2006 was $46.11, $59.49 and $44.37, respectively. The total fair value of performance shares vested
during 2007 was $1 million, while 2006 was insignificant. There were no performance shares which
vested during 2008.
As of September 26, 2008, there was $86 million of total unrecognized compensation cost related
to both non-vested restricted share awards and performance shares. That cost is expected to be
recognized over a weighted-average period of 2.4 fiscal years.
Deferred Stock Units Deferred Stock Units (‘‘DSUs’’) are notional units that are tied to the value of
Tyco common shares with distribution deferred until termination of employment. Distribution, when
made, will be in the form of actual shares. Similar to restricted share grants that vest through the passage
of time, the fair value of DSUs is determined based on the market value of the Company’s shares on the
grant date and is amortized to expense over the vesting period. Recipients of DSUs do not have the right
to vote such shares and do not have the right to receive cash dividends. However, they have the right to
receive dividend equivalents. Conditions of vesting are determined at the time of grant. Under the 2004
Plan, the majority of Tyco’s DSU grants vest in equal annual installments over three years. The Company
has granted 1 million DSUs, the majority of which were outstanding at September 26, 2008.
2008 Financials 159