ADT 2008 Annual Report Download - page 151
Download and view the complete annual report
Please find page 151 of the 2008 ADT annual report below. You can navigate through the pages in the report by either clicking on the pages listed below, or by using the keyword search tool below to find specific information within the annual report.-
 1
1 -
2
-
3
-
4
-
5
-
6
-
7
-
8
-
9
-
10
-
11
-
12
-
13
-
14
-
15
-
16
-
17
-
18
-
19
-
20
-
21
-
22
-
23
-
24
-
25
-
26
-
27
-
28
-
29
-
30
-
31
-
32
-
33
-
34
-
35
-
36
-
37
-
38
-
39
-
40
-
41
-
42
-
43
-
44
-
45
-
46
-
47
-
48
-
49
-
50
-
51
-
52
-
53
-
54
-
55
-
56
-
57
-
58
-
59
-
60
-
61
-
62
-
63
-
64
-
65
-
66
-
67
-
68
-
69
-
70
-
71
-
72
-
73
-
74
-
75
-
76
-
77
-
78
-
79
-
80
-
81
-
82
-
83
-
84
-
85
-
86
-
87
-
88
-
89
-
90
-
91
-
92
-
93
-
94
-
95
-
96
-
97
-
98
-
99
-
100
-
101
-
102
-
103
-
104
-
105
-
106
-
107
-
108
-
109
-
110
-
111
-
112
-
113
-
114
-
115
-
116
-
117
-
118
-
119
-
120
-
121
-
122
-
123
-
124
-
125
-
126
-
127
-
128
-
129
-
130
-
131
-
132
-
133
-
134
-
135
-
136
-
137
-
138
-
139
-
140
-
 141
141 -
 142
142 -
 143
143 -
 144
144 -
 145
145 -
 146
146 -
 147
147 -
 148
148 -
 149
149 -
 150
150 -
 151
151 -
 152
152 -
 153
153 -
 154
154 -
 155
155 -
 156
156 -
 157
157 -
 158
158 -
 159
159 -
 160
160 -
 161
161 -
162
-
163
-
164
-
165
-
166
-
167
-
168
-
169
-
170
-
171
-
172
-
173
-
174
-
175
-
176
-
177
-
178
-
179
-
180
-
181
-
182
-
183
-
184
-
185
-
186
-
187
-
188
-
189
-
190
-
191
-
192
-
193
-
194
-
195
-
196
-
197
-
198
-
199
-
200
-
201
-
202
-
203
-
204
-
205
-
206
-
207
-
208
-
209
-
210
-
211
-
212
-
213
-
214
-
215
-
216
-
217
-
218
-
219
-
220
-
221
-
222
-
223
-
224
-
225
-
226
-
227
-
228
-
229
-
230
-
231
-
232
-
233
-
234
-
235
-
236
-
237
-
238
-
239
-
240
-
241
-
242
-
243
-
244
-
245
-
246
-
247
-
248
-
249
-
250
-
251
-
252
-
253
-
254
-
255
-
256
-
257
-
258
-
259
-
260
-
261
-
262
-
263
-
264
-
265
-
266
-
267
-
268
-
269
-
270
-
271
-
272
-
273
-
274
-
275
-
276
-
277
-
278
-
279
-
280
-
281
-
282
-
283
 |
 |

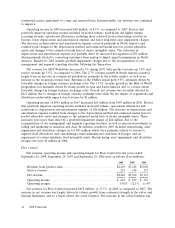
Operating income increased $63 million, or 24.4%, during 2008 as compared to 2007 resulting
largely from increased volume and improved margins, primarily in North America, and to a lesser
extent, Asia and EMEA. The increase in operating income during 2008 was partially offset by
$22 million of restructuring, asset impairment and divestiture charges. Also, operating income was
unfavorably impacted by $9 million due to a goodwill impairment in the Latin America reporting unit.
Net revenue for Fire Protection Services increased $216 million, or 6.9%, during 2007 as compared
to 2006, driven largely by a 9.9% increase in revenue from product sales. This increase was largely the
result of strong growth in most regions which benefited from continuing strength in commercial
construction activity in our focused end-markets. Changes in foreign currency exchange rates had a
favorable impact of $101 million while divestitures had a negative impact of $30 million.
Operating income increased $17 million during 2007 as compared to 2006 resulting largely from
increased volume, and improved margins, primarily in North America. Results for 2007 included
restructuring, asset impairment and divestiture charges, net of $23 million, of which $1 million is
included in cost of sales, primarily related to actions to improve field efficiencies and consolidate
certain administrative functions in Europe. Operating income was unfavorably impacted by $1 million
of divestiture charges, compared to no charges in 2006.
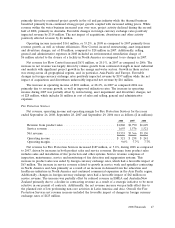
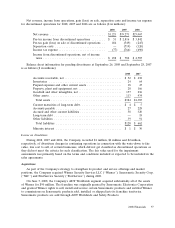
Electrical and Metal Products
Net revenue, operating income and operating margin for Electrical and Metal Products for the
years ended September 26, 2008, September 28, 2007 and September 29, 2006 were as follows ($ in
millions):
2008 2007 2006
Revenue from product sales ............................. $2,266 $1,970 $1,946
Service revenue ......................................643
Net revenue ........................................ $2,272 $1,974 $1,949
Operating income .................................... $ 342 $ 159 $ 319
Operating margin ..................................... 15.1% 8.1% 16.4%
Net revenue for Electrical and Metal Products increased $298 million, or 15.1%, in 2008 as
compared to 2007. The increase in net revenue was largely driven by selling price increases for steel
tubular products and to a lesser extent armored cable products partially offset by decreased sales
volume for both products. Changes in foreign currency exchange rates had a favorable impact of
$44 million.
Operating income increased $183 million, or 115.1%, in 2008 as compared to 2007. The increase in
operating income was primarily due to favorable spreads on both steel tubular and armored cable
products. As inventory is replenished at higher prices, the spreads will narrow, which will result in
lower operating income. Income generated by higher selling prices for both steel tubular and armored
cable products were partially offset by decreased sales volume for both products. Operational
excellence initiatives resulted in reductions in production cost rates for both steel tubular and armored
cable products. The increase in operating income during 2008 was partially offset by $43 million of
restructuring, asset impairment and divestiture charges, as compared to $7 million in 2007.
Net revenue for Electrical and Metal Products increased $25 million, or 1.3%, in 2007 as compared
to 2006. Favorable changes in foreign currency exchange rates of $20 million contributed to the
increase in revenue. The increase in net revenue was largely driven by increased sales volume of
armored cable products, steel tubular products, and higher selling prices and sales volumes in Brazil.
These increases were largely offset by the impact of lower selling prices on steel tubular products in
North America.
48 2008 Financials