ADT 2008 Annual Report Download - page 152
Download and view the complete annual report
Please find page 152 of the 2008 ADT annual report below. You can navigate through the pages in the report by either clicking on the pages listed below, or by using the keyword search tool below to find specific information within the annual report.-
 1
1 -
2
-
3
-
4
-
5
-
6
-
7
-
8
-
9
-
10
-
11
-
12
-
13
-
14
-
15
-
16
-
17
-
18
-
19
-
20
-
21
-
22
-
23
-
24
-
25
-
26
-
27
-
28
-
29
-
30
-
31
-
32
-
33
-
34
-
35
-
36
-
37
-
38
-
39
-
40
-
41
-
42
-
43
-
44
-
45
-
46
-
47
-
48
-
49
-
50
-
51
-
52
-
53
-
54
-
55
-
56
-
57
-
58
-
59
-
60
-
61
-
62
-
63
-
64
-
65
-
66
-
67
-
68
-
69
-
70
-
71
-
72
-
73
-
74
-
75
-
76
-
77
-
78
-
79
-
80
-
81
-
82
-
83
-
84
-
85
-
86
-
87
-
88
-
89
-
90
-
91
-
92
-
93
-
94
-
95
-
96
-
97
-
98
-
99
-
100
-
101
-
102
-
103
-
104
-
105
-
106
-
107
-
108
-
109
-
110
-
111
-
112
-
113
-
114
-
115
-
116
-
117
-
118
-
119
-
120
-
121
-
122
-
123
-
124
-
125
-
126
-
127
-
128
-
129
-
130
-
131
-
132
-
133
-
134
-
135
-
136
-
137
-
138
-
139
-
140
-
141
-
 142
142 -
 143
143 -
 144
144 -
 145
145 -
 146
146 -
 147
147 -
 148
148 -
 149
149 -
 150
150 -
 151
151 -
 152
152 -
 153
153 -
 154
154 -
 155
155 -
 156
156 -
 157
157 -
 158
158 -
 159
159 -
 160
160 -
 161
161 -
 162
162 -
163
-
164
-
165
-
166
-
167
-
168
-
169
-
170
-
171
-
172
-
173
-
174
-
175
-
176
-
177
-
178
-
179
-
180
-
181
-
182
-
183
-
184
-
185
-
186
-
187
-
188
-
189
-
190
-
191
-
192
-
193
-
194
-
195
-
196
-
197
-
198
-
199
-
200
-
201
-
202
-
203
-
204
-
205
-
206
-
207
-
208
-
209
-
210
-
211
-
212
-
213
-
214
-
215
-
216
-
217
-
218
-
219
-
220
-
221
-
222
-
223
-
224
-
225
-
226
-
227
-
228
-
229
-
230
-
231
-
232
-
233
-
234
-
235
-
236
-
237
-
238
-
239
-
240
-
241
-
242
-
243
-
244
-
245
-
246
-
247
-
248
-
249
-
250
-
251
-
252
-
253
-
254
-
255
-
256
-
257
-
258
-
259
-
260
-
261
-
262
-
263
-
264
-
265
-
266
-
267
-
268
-
269
-
270
-
271
-
272
-
273
-
274
-
275
-
276
-
277
-
278
-
279
-
280
-
281
-
282
-
283
 |
 |

The decrease in operating income of $160 million, or 50.2%, in 2007 as compared to 2006 was
primarily due to unfavorable spreads on both steel tubular and armored cable products. Income
generated by higher sales volume for both armored cable and steel tubular products were more than
offset by lower selling prices and higher raw material prices. Results for 2007 included restructuring,
asset impairment, and divestiture charges, net of $7 million, compared to no charges in 2006.
Safety Products
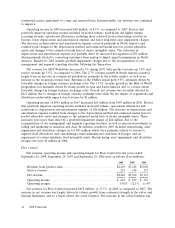
Net revenue, operating income and operating margin for Safety Products for the years ended
September 26, 2008, September 28, 2007 and September 29, 2006 were as follows ($ in millions):
2008 2007 2006
Revenue from product sales ............................. $1,916 $1,704 $1,608
Service revenue ...................................... 18 15 16
Net revenue ........................................ $1,934 $1,719 $1,624
Operating income .................................... $ 284 $ 274 $ 196
Operating margin ..................................... 14.7% 15.9% 12.1%
Net revenue for Safety Products increased $215 million, or 12.5%, during 2008 as compared to
2007 primarily from strong performance in the fire suppression, and to a lesser extent electronic
security and life safety businesses. The increase in the fire suppression business was driven by continued
growth in the energy and marine sectors, favorable product mix and increased selling prices to offset
increasing raw material costs. The increase in the life safety business was primarily driven by growth in
North America as a result of increased spending by fire departments due to the release of federal
funds, and from increased selling prices. The increase in the electronic security business was partially
due to higher volume and new product introductions primarily related to casinos and schools. Favorable
changes in foreign currency exchange rates of $76 million also contributed to the increase in revenue.
Operating income increased $10 million, or 3.6% in 2008 as compared to 2007. The increase in
operating income was primarily attributable to increased sales volume along with the impact of cost
savings from operational excellence initiatives. The increase in operating income during 2008 was
partially offset by $73 million of restructuring, asset impairment, and divestiture charges, net as
compared to $29 million in 2007.
Net revenue for Safety Products increased $95 million, or 5.8%, during 2007 as compared to 2006
primarily from strong performance in the fire suppression and electronic security businesses. Favorable
changes in foreign currency exchange rates of $49 million also contributed to the increase in revenue.
The increase in the fire suppression business was driven by continued growth in the energy and marine
sectors in the Americas and the Middle East as well as increased selling prices to help offset the
significant cost increase of raw materials. The electronic security business also experienced favorable
growth as a result of new product introductions and new market expansions. These increases were
partially offset by continued softness in the life safety business in North America due to delays of
federal assistance provided to fire departments.
Operating income increased $78 million to $274 million for the year ended September 28, 2007
compared to the prior year. Prior year results included a $100 million charge related to a pre-existing
Voluntary Replacement Program (‘‘VRP’’) for sprinkler heads in the fire suppression business. The
deadline for filing claims to participate in the VRP ended on August 31, 2007. In light of the most
current claims data, an additional $10 million charge was recorded in the fourth quarter of 2007. Also,
2007 results include the effect of restructuring, asset impairment, and divestiture charges, net of
$29 million.
2008 Financials 49