ADT 2008 Annual Report Download - page 250
Download and view the complete annual report
Please find page 250 of the 2008 ADT annual report below. You can navigate through the pages in the report by either clicking on the pages listed below, or by using the keyword search tool below to find specific information within the annual report.
TYCO INTERNATIONAL LTD.
NOTES TO CONSOLIDATED FINANCIAL STATEMENTS
17. Retirement Plans
In September 2006, the FASB issued SFAS No. 158 which requires the recognition of the funded
status of defined benefit pension and other postretirement benefit plans on the Company’s
Consolidated Balance Sheets. SFAS No. 158 requires recognition of the actuarial gains or losses and
prior service costs that have not yet been included in net periodic benefit cost as a component of
accumulated other comprehensive income, net of tax. The Company adopted the recognition and
disclosure provisions of SFAS No. 158 on September 28, 2007. The Company uses a measurement date
of August 31st.
Defined Benefit Pension Plans The Company has a number of noncontributory and contributory
defined benefit retirement plans covering certain of its U.S. and non-U.S. employees, designed in
accordance with conditions and practices in the countries concerned. Net periodic pension benefit cost
is based on periodic actuarial valuations which use the projected unit credit method of calculation and
is charged to the Consolidated Statements of Operations on a systematic basis over the expected
average remaining service lives of current participants. Contribution amounts are determined based on
the advice of professionally qualified actuaries in the countries concerned. The benefits under the
defined benefit plans are based on various factors, such as years of service and compensation.
In connection with the Separation, the Company legally separated certain pension plans that
included participants of Tyco Healthcare, Tyco Electronics and other subsidiaries. As a result, the
Company remeasured the assets and projected benefit obligation of the separated pension plans. The
impact of the remeasurement on continuing operations was immaterial. Also, during 2007, the
Company completed the merger of certain pension plans in the United Kingdom, which resulted in an
increase to the minimum pension liability with a corresponding decrease to accumulated other
comprehensive income of $10 million, net of income taxes.
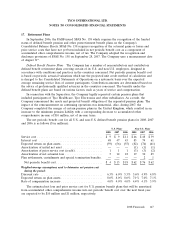
The net periodic benefit cost for all U.S. and non-U.S. defined benefit pension plans for 2008, 2007
and 2006 is as follows ($ in millions):
U.S. Plans Non-U.S. Plans
2008 2007 2006 2008 2007 2006
Service cost ...................................... $ 9 $ 9 $11 $46 $48 $39
Interest cost ..................................... 48 47 43 83 74 61
Expected return on plan assets ........................ (59) (56) (55) (82) (74) (61)
Amortization of initial net asset .......................——— (1)(1)(1)
Amortization of prior service cost (credit) ................111(3)(3)(2)
Amortization of net actuarial loss ...................... 5 12 18 19 30 25
Plan settlements, curtailments and special termination benefits .———— 2 1
Net periodic benefit cost ........................... $ 4 $13 $18 $62 $76 $62
Weighted-average assumptions used to determine net pension cost
during the period:
Discount rate .................................... 6.3% 6.0% 5.3% 5.6% 4.9% 4.8%
Expected return on plan assets ........................ 8.0% 8.0% 8.0% 7.1% 7.0% 7.1%
Rate of compensation increase ........................ 4.0% 4.0% 4.0% 4.4% 4.1% 3.9%
The estimated net loss and prior service cost for U.S. pension benefit plans that will be amortized
from accumulated other comprehensive income into net periodic benefit cost over the next fiscal year
are expected to be $10 million and $1 million, respectively.
2008 Financials 147


