ADT 2008 Annual Report Download - page 202
Download and view the complete annual report
Please find page 202 of the 2008 ADT annual report below. You can navigate through the pages in the report by either clicking on the pages listed below, or by using the keyword search tool below to find specific information within the annual report.-
 1
1 -
2
-
3
-
4
-
5
-
6
-
7
-
8
-
9
-
10
-
11
-
12
-
13
-
14
-
15
-
16
-
17
-
18
-
19
-
20
-
21
-
22
-
23
-
24
-
25
-
26
-
27
-
28
-
29
-
30
-
31
-
32
-
33
-
34
-
35
-
36
-
37
-
38
-
39
-
40
-
41
-
42
-
43
-
44
-
45
-
46
-
47
-
48
-
49
-
50
-
51
-
52
-
53
-
54
-
55
-
56
-
57
-
58
-
59
-
60
-
61
-
62
-
63
-
64
-
65
-
66
-
67
-
68
-
69
-
70
-
71
-
72
-
73
-
74
-
75
-
76
-
77
-
78
-
79
-
80
-
81
-
82
-
83
-
84
-
85
-
86
-
87
-
88
-
89
-
90
-
91
-
92
-
93
-
94
-
95
-
96
-
97
-
98
-
99
-
100
-
101
-
102
-
103
-
104
-
105
-
106
-
107
-
108
-
109
-
110
-
111
-
112
-
113
-
114
-
115
-
116
-
117
-
118
-
119
-
120
-
121
-
122
-
123
-
124
-
125
-
126
-
127
-
128
-
129
-
130
-
131
-
132
-
133
-
134
-
135
-
136
-
137
-
138
-
139
-
140
-
141
-
142
-
143
-
144
-
145
-
146
-
147
-
148
-
149
-
150
-
151
-
152
-
153
-
154
-
155
-
156
-
157
-
158
-
159
-
160
-
161
-
162
-
163
-
164
-
165
-
166
-
167
-
168
-
169
-
170
-
171
-
172
-
173
-
174
-
175
-
176
-
177
-
178
-
179
-
180
-
181
-
182
-
183
-
184
-
185
-
186
-
187
-
188
-
189
-
190
-
191
-
 192
192 -
 193
193 -
 194
194 -
 195
195 -
 196
196 -
 197
197 -
 198
198 -
 199
199 -
 200
200 -
 201
201 -
 202
202 -
 203
203 -
 204
204 -
 205
205 -
 206
206 -
 207
207 -
 208
208 -
 209
209 -
 210
210 -
 211
211 -
 212
212 -
213
-
214
-
215
-
216
-
217
-
218
-
219
-
220
-
221
-
222
-
223
-
224
-
225
-
226
-
227
-
228
-
229
-
230
-
231
-
232
-
233
-
234
-
235
-
236
-
237
-
238
-
239
-
240
-
241
-
242
-
243
-
244
-
245
-
246
-
247
-
248
-
249
-
250
-
251
-
252
-
253
-
254
-
255
-
256
-
257
-
258
-
259
-
260
-
261
-
262
-
263
-
264
-
265
-
266
-
267
-
268
-
269
-
270
-
271
-
272
-
273
-
274
-
275
-
276
-
277
-
278
-
279
-
280
-
281
-
282
-
283
 |
 |

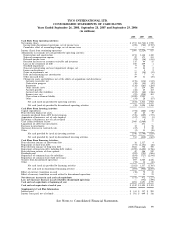
TYCO INTERNATIONAL LTD.
CONSOLIDATED STATEMENTS OF CASH FLOWS
Years Ended September 26, 2008, September 28, 2007 and September 29, 2006
(in millions)
2008 2007 2006
Cash Flows From Operating Activities:
Net income (loss) ......................................................... $1,553 $(1,742) $ 3,590
Income from discontinued operations, net of income taxes ............................... (458) (782) (2,787)
Cumulative effect of accounting change, net of income taxes .............................. — — 14
Income (Loss) from continuing operations .......................................... 1,095 (2,524) 817
Adjustments to reconcile net cash provided by operating activities:
Depreciation and amortization ................................................ 1,154 1,148 1,180
Non-cash compensation expense ............................................... 99 173 151
Deferred income taxes ..................................................... (94) (16) (413)
Provision for losses on accounts receivable and inventory ................................ 135 94 55
Loss on the retirement of debt ................................................ 258 259 1
Goodwill impairment ...................................................... 9 46 —
Non-cash restructuring and asset impairment charges, net ................................ 37 24 2
Losses on divestitures ...................................................... — 4 2
Gains on investments, net ................................................... 13 (10) (12)
Debt and refinancing cost amortization ........................................... 59 7 6
Other non-cash items ...................................................... 29 31 (30)
Changes in assets and liabilities, net of the effects of acquisitions and divestitures:
Accounts receivable, net ................................................... (176) (136) (143)
Contracts in progress .................................................... (26) (44) (49)
Inventories ........................................................... (138) (163) (104)
Other current assets ..................................................... 11 154 206
Accounts payable ....................................................... (16) 65 163
Accrued and other liabilities ................................................ (152) (68) (166)
Income taxes, net ....................................................... (95) (250) 403
Class action settlement liability ............................................... (3,020) 2,992 —
Other .............................................................. (54) 28 (87)
Net cash (used in) provided by operating activities ................................. (872) 1,814 1,982
Net cash (used in) provided by discontinued operating activities ......................... (18) 2,498 3,584
Cash Flows From Investing Activities:
Capital expenditures ........................................................ (734) (666) (556)
Proceeds from disposal of assets ................................................. 28 23 39
Accounts purchased from ADT dealer program ....................................... (376) (409) (373)
Acquisition of businesses, net of cash acquired ........................................ (347) (31) (5)
Divestiture of businesses, net of cash retained ........................................ 1 8 11
Class action settlement escrow .................................................. 2,960 (2,960) —
Liquidation of rabbi trust investments ............................................. — 271 —
Decrease in investments ..................................................... 32 4 58
(Increase) decrease in restricted cash .............................................. (17) 5 20
Other ................................................................. (1) 15 (18)
Net cash provided by (used in) investing activities .................................. 1,546 (3,740) (824)
Net cash provided by (used in) discontinued investing activities .......................... 911 (810) (603)
Cash Flows From Financing Activities:
Proceeds from issuance of short-term debt .......................................... 16 1,517 4
Repayment of short-term debt .................................................. (377) (1,151) (28)
Proceeds from issuance of long-term debt ........................................... 3,864 308 700
Repayment of long-term debt, including debt tenders .................................... (4,050) (6,602) (1,766)
Proceeds from exercise of share options ............................................ 49 406 249
Dividends paid ........................................................... (292) (791) (806)
Repurchase of common shares by subsidiary ......................................... (854) (727) (2,544)
Repurchase of common shares held in treasury ........................................ (192) — —
Transfer from discontinued operations ............................................. 897 8,585 2,436
Other ................................................................. (72) 12 (10)
Net cash (used in) provided by financing activities ................................. (1,011) 1,557 (1,765)
Net cash used in discontinued financing activities .................................. (893) (950) (2,693)
Effect of currency translation on cash ............................................. (38) 70 21
Effect of currency translation on cash related to discontinued operations ........................ — 33 21
Net (decrease) increase in cash and cash equivalents .................................... (375) 472 (277)
Less: net (increase) decrease in cash related to discontinued operations ........................ — (771) (309)
Cash and cash equivalents at beginning of year ....................................... 1,894 2,193 2,779
Cash and cash equivalents at end of year ........................................... $1,519 $ 1,894 $ 2,193
Supplementary Cash Flow Information:
Interest paid ............................................................ $ 313 $ 317 $ 285
Income taxes paid, net of refunds ................................................ $ 501 $ 649 $ 316
See Notes to Consolidated Financial Statements.
2008 Financials 99