ADT 2008 Annual Report Download - page 46
Download and view the complete annual report
Please find page 46 of the 2008 ADT annual report below. You can navigate through the pages in the report by either clicking on the pages listed below, or by using the keyword search tool below to find specific information within the annual report.group and other companies identified by relevant market survey data, and internal pay equity
considerations.
The starting point for the Compensation Committee’s benchmarking analysis is the analysis of
comparable market data. For fiscal 2008 and beyond, the Compensation Committee determined that
the companies identified below would constitute the Company’s peer group for benchmarking purposes.
The Compensation Committee then used market data for the peer group to determine that base
salaries for our named executive officers should be positioned around the market 50th percentile, and
that the sum of base salaries and performance-based pay should be positioned between the market
50th and 75th percentile. While these benchmarks represent useful guidelines, the Compensation
Committee exercises discretion in setting individual executive pay so that it appropriately reflects the
value and contributions of each executive, as well as the executive’s leadership, commitment to our
values, and potential for advancement.
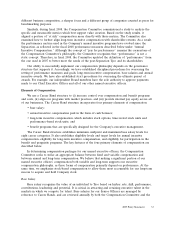
The peer group identified by the Compensation Committee consists of industrial companies and
service-based companies (including companies outside of our industry) that reflect the competitive
landscape in which Tyco has been operating since the Separation. Peer group members are as follows.
Peer Group Companies
• 3M • Honeywell International • Sprint Nextel
• Deere & Co. • Illinois Tool Works • United Technologies
• DirecTV • Ingersoll-Rand • Waste Management
• Emerson Electric • L-3 Communications • UPS
• FedEx • Masco
• General Dynamics • Raytheon
The peer group was drawn from companies in the S&P 500 Index. The Compensation Committee
analyzed a range of factors for each member: (i) rank within the S&P 500 Index, (ii) various financial
size and performance metrics, (iii) number of employees, and (iv) business lines and the extent that
they overlap Tyco’s business lines, and (v) other indicia of common managerial skill sets.
The Compensation Committee considers summary statistical information regarding general industry
practices (excepting those of financial service companies) as a second potential source of executive
compensation market data. The Compensation Committee believes that this information provides
important additional data that the Committee should consider in its decision-making process. The
Compensation Committee anticipates that the peer group will change if the Company’s size or lines of
business change, or if the peer companies show changes in their businesses or operations. Any change
to the compensation peer group is subject to the Compensation Committee’s approval.
Recommendations of Company Management
In general, the independent compensation consultant develops pay strategies and recommendations
for the Chief Executive Officer, which the consultant provides to the Compensation Committee. The
Committee and the consultant then review and discuss all matters involving the Chief Executive
Officer’s compensation. After this review, the Compensation Committee prepares its own
recommendation for the Board to review and discuss. The independent members of our Board have the
sole authority to approve compensation decisions made with respect to the Chief Executive Officer, and
the Board has established the scorecard against which the performance of the Chief Executive Officer
is measured. The basis of the scorecard is the financial plan, as approved by the Board. However, the
Compensation Committee reviews and approves the performance goals and objectives relevant to the
2009 Proxy Statement 29


