ADT 2008 Annual Report Download - page 52
Download and view the complete annual report
Please find page 52 of the 2008 ADT annual report below. You can navigate through the pages in the report by either clicking on the pages listed below, or by using the keyword search tool below to find specific information within the annual report.-
 1
1 -
2
-
3
-
4
-
5
-
6
-
7
-
8
-
9
-
10
-
11
-
12
-
13
-
14
-
15
-
16
-
17
-
18
-
19
-
20
-
21
-
22
-
23
-
24
-
25
-
26
-
27
-
28
-
29
-
30
-
31
-
32
-
33
-
34
-
35
-
36
-
37
-
38
-
39
-
40
-
41
-
 42
42 -
 43
43 -
 44
44 -
 45
45 -
 46
46 -
 47
47 -
 48
48 -
 49
49 -
 50
50 -
 51
51 -
 52
52 -
 53
53 -
 54
54 -
 55
55 -
 56
56 -
 57
57 -
 58
58 -
 59
59 -
 60
60 -
 61
61 -
 62
62 -
63
-
64
-
65
-
66
-
67
-
68
-
69
-
70
-
71
-
72
-
73
-
74
-
75
-
76
-
77
-
78
-
79
-
80
-
81
-
82
-
83
-
84
-
85
-
86
-
87
-
88
-
89
-
90
-
91
-
92
-
93
-
94
-
95
-
96
-
97
-
98
-
99
-
100
-
101
-
102
-
103
-
104
-
105
-
106
-
107
-
108
-
109
-
110
-
111
-
112
-
113
-
114
-
115
-
116
-
117
-
118
-
119
-
120
-
121
-
122
-
123
-
124
-
125
-
126
-
127
-
128
-
129
-
130
-
131
-
132
-
133
-
134
-
135
-
136
-
137
-
138
-
139
-
140
-
141
-
142
-
143
-
144
-
145
-
146
-
147
-
148
-
149
-
150
-
151
-
152
-
153
-
154
-
155
-
156
-
157
-
158
-
159
-
160
-
161
-
162
-
163
-
164
-
165
-
166
-
167
-
168
-
169
-
170
-
171
-
172
-
173
-
174
-
175
-
176
-
177
-
178
-
179
-
180
-
181
-
182
-
183
-
184
-
185
-
186
-
187
-
188
-
189
-
190
-
191
-
192
-
193
-
194
-
195
-
196
-
197
-
198
-
199
-
200
-
201
-
202
-
203
-
204
-
205
-
206
-
207
-
208
-
209
-
210
-
211
-
212
-
213
-
214
-
215
-
216
-
217
-
218
-
219
-
220
-
221
-
222
-
223
-
224
-
225
-
226
-
227
-
228
-
229
-
230
-
231
-
232
-
233
-
234
-
235
-
236
-
237
-
238
-
239
-
240
-
241
-
242
-
243
-
244
-
245
-
246
-
247
-
248
-
249
-
250
-
251
-
252
-
253
-
254
-
255
-
256
-
257
-
258
-
259
-
260
-
261
-
262
-
263
-
264
-
265
-
266
-
267
-
268
-
269
-
270
-
271
-
272
-
273
-
274
-
275
-
276
-
277
-
278
-
279
-
280
-
281
-
282
-
283
 |
 |

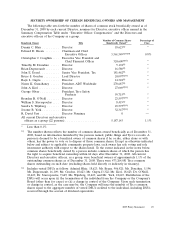
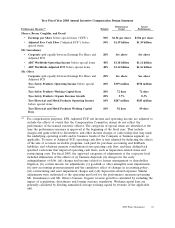
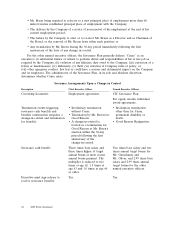
Tyco Fiscal Year 2008 Annual Incentive Compensation Design Summary
Performance Actual
Performance Measure(1) Weights Target Performance
Messrs. Breen, Coughlin, and Evard
•Earnings per Share before special items (‘‘EPS’’) 50% $2.56 per share $3.06 per share
•Adjusted Free Cash Flow (‘‘Adjusted FCF’’) before 50% $1.19 billion $1.30 billion
special items
Mr. Gursahaney
•Corporate split equally between Earnings Per Share and 20% See above See above
Adjusted FCF
•ADT Worldwide Operating Income before special items 40% $1.18 billion $1.11 billion
•ADT Worldwide Adjusted FCF before special items 40% $1.14 billion $1.16 billion
Mr. Oliver
Corporate split equally between Earnings Per Share and 20% See above See above
Adjusted FCF
Tyco Safety Products Operating Income before special 20% $339 million $358 million
items
Tyco Safety Products Working Capital Days 20% 72 days 72 days
Tyco Safety Products Organic Revenue Growth 20% 5.7% 8.3%
Tyco Electrical and Metal Products Operating Income 10% $207 million $385 million
before special items
Tyco Electrical and Metal Products Working Capital 10% 92 days 89 days
Days
(1) For compensation purposes, EPS, Adjusted FCF, net income and operating income are adjusted to
exclude the effects of events that the Compensation Committee deems do not reflect the
performance of the named executive officers. The categories of special items are identified at the
time the performance measure is approved at the beginning of the fiscal year. They include
charges and gains related to divestitures, and other income charges or cash outlays that may mask
the underlying operating results and/or business trends of the Company or business segment, as
applicable. To arrive at Adjusted FCF, operating cash flow is first adjusted by deducting the effects
of the sale of accounts receivable programs, cash paid for purchase accounting and holdback
liabilities, and voluntary pension contributions from operating cash flow, and then adding back
specified cash items that impacted operating cash flows, such as Separation-related items and
restructuring costs. For fiscal 2008, the approved categories of adjustments at the corporate level
included elimination of the effects of (i) business disposals, (ii) charges for the early
extinguishment of debt, (iii) charges and income related to former management or shareholder
litigation, (iv) certain income tax adjustments, (v) goodwill or other intangible asset impairments,
(vi) new accounting pronouncements and the cumulative effect of changes in accounting policy,
(vii) restructuring and asset impairment charges and (viii) Separation-related expenses. Similar
adjustments were authorized at the operating unit level for the performance measures governing
Mr. Gursahaney’s and Mr. Oliver’s bonuses. Organic revenue growth is calculated by excluding the
impact of acquisitions, divestitures and foreign currency translation. Working capital days are
generally calculated by dividing annualized average working capital by revenue of the applicable
unit.
2009 Proxy Statement 35