ADT 2008 Annual Report Download - page 69
Download and view the complete annual report
Please find page 69 of the 2008 ADT annual report below. You can navigate through the pages in the report by either clicking on the pages listed below, or by using the keyword search tool below to find specific information within the annual report.-
 1
1 -
 2
2 -
 3
3 -
 4
4 -
 5
5 -
 6
6 -
 7
7 -
 8
8 -
 9
9 -
 10
10 -
 11
11 -
 12
12 -
 13
13 -
 14
14 -
 15
15 -
 16
16 -
 17
17 -
 18
18 -
 19
19 -
 20
20 -
 21
21 -
 22
22 -
 23
23 -
 24
24 -
 25
25 -
 26
26 -
 27
27 -
 28
28 -
 29
29 -
 30
30 -
 31
31 -
 32
32 -
 33
33 -
 34
34 -
 35
35 -
 36
36 -
 37
37 -
 38
38 -
 39
39 -
 40
40 -
 41
41 -
 42
42 -
 43
43 -
 44
44 -
 45
45 -
 46
46 -
 47
47 -
 48
48 -
 49
49 -
 50
50 -
 51
51 -
 52
52 -
 53
53 -
 54
54 -
 55
55 -
 56
56 -
 57
57 -
 58
58 -
 59
59 -
 60
60 -
 61
61 -
 62
62 -
 63
63 -
 64
64 -
 65
65 -
 66
66 -
 67
67 -
 68
68 -
 69
69 -
 70
70 -
 71
71 -
 72
72 -
 73
73 -
 74
74 -
 75
75 -
 76
76 -
 77
77 -
 78
78 -
 79
79 -
 80
80 -
 81
81 -
 82
82 -
 83
83 -
 84
84 -
 85
85 -
 86
86 -
 87
87 -
 88
88 -
 89
89 -
 90
90 -
 91
91 -
 92
92 -
 93
93 -
 94
94 -
 95
95 -
 96
96 -
 97
97 -
 98
98 -
 99
99 -
 100
100 -
 101
101 -
 102
102 -
 103
103 -
 104
104 -
 105
105 -
 106
106 -
 107
107 -
 108
108 -
 109
109 -
 110
110 -
 111
111 -
 112
112 -
 113
113 -
 114
114 -
 115
115 -
 116
116 -
 117
117 -
 118
118 -
 119
119 -
 120
120 -
 121
121 -
 122
122 -
 123
123 -
 124
124 -
 125
125 -
 126
126 -
 127
127 -
 128
128 -
 129
129 -
 130
130 -
 131
131 -
 132
132 -
 133
133 -
 134
134 -
 135
135 -
 136
136 -
 137
137 -
 138
138 -
 139
139 -
 140
140 -
 141
141 -
 142
142 -
 143
143 -
 144
144 -
 145
145 -
 146
146 -
 147
147 -
 148
148 -
 149
149 -
 150
150 -
 151
151 -
 152
152 -
 153
153 -
 154
154 -
 155
155 -
 156
156 -
 157
157 -
 158
158 -
 159
159 -
 160
160 -
 161
161 -
 162
162 -
 163
163 -
 164
164 -
 165
165 -
 166
166 -
 167
167 -
 168
168 -
 169
169 -
 170
170 -
 171
171 -
 172
172 -
 173
173 -
 174
174 -
 175
175 -
 176
176 -
 177
177 -
 178
178 -
 179
179 -
 180
180 -
 181
181 -
 182
182 -
 183
183 -
 184
184 -
 185
185 -
 186
186 -
 187
187 -
 188
188 -
 189
189 -
 190
190 -
 191
191 -
 192
192 -
 193
193 -
 194
194 -
 195
195 -
 196
196 -
 197
197 -
 198
198 -
 199
199 -
 200
200 -
 201
201 -
 202
202 -
 203
203 -
 204
204 -
 205
205 -
 206
206 -
 207
207 -
 208
208 -
 209
209 -
 210
210 -
 211
211 -
 212
212 -
 213
213 -
 214
214 -
 215
215 -
 216
216 -
 217
217 -
 218
218 -
 219
219 -
 220
220 -
 221
221 -
 222
222 -
 223
223 -
 224
224 -
 225
225 -
 226
226 -
 227
227 -
 228
228 -
 229
229 -
 230
230 -
 231
231 -
 232
232 -
 233
233 -
 234
234 -
 235
235 -
 236
236 -
 237
237 -
 238
238 -
 239
239 -
 240
240 -
 241
241 -
 242
242 -
 243
243 -
 244
244 -
 245
245 -
 246
246 -
 247
247 -
 248
248 -
 249
249 -
 250
250 -
 251
251 -
 252
252 -
 253
253 -
 254
254 -
 255
255 -
 256
256 -
 257
257 -
 258
258 -
 259
259 -
 260
260 -
 261
261 -
 262
262 -
 263
263 -
 264
264 -
 265
265 -
 266
266 -
 267
267 -
 268
268 -
 269
269 -
 270
270 -
 271
271 -
 272
272 -
 273
273 -
 274
274 -
 275
275 -
 276
276 -
 277
277 -
 278
278 -
 279
279 -
 280
280 -
 281
281 -
 282
282 -
 283
283
 |
 |

Exercise Edward D. Christopher J. George R. Naren K.
Vesting Date Price Breen Coughlin Oliver John Evard Gursahaney
Number of Shares Underlying Vesting Awards
2008
11/21/2008 ............... 48.14 99,929 47,210 12,589 22,031
11/22/2008 ............... 46.07 41,458 20,729 5,472 8,393
2009
1/12/2009 ................ 48.67 3,147
7/2/2009 ................. 53.36 73,000 34,750 17,750 9,750 17,750
7/10/2009 ................ 43.72 20,982
11/21/2009 ............... 48.14 99,928 47,210 12,589 22,031
2010
7/2/2010 ................. 53.36 73,000 34,750 17,750 9,750 17,750
11/21/2010 ............... 48.14 99,929 47,211 12,590 22,032
2011
7/2/2011 ................. 53.36 73,000 34,750 17,750 9,750 17,750
8/18/2011 ................ 44.49 17,500 17,500
2012
8/18/2012 ................ 44.49 17,500 17,500
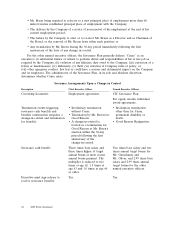
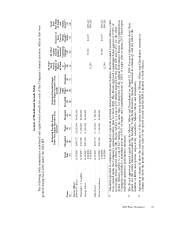
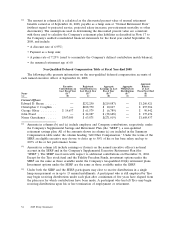
(2) The amounts in columns (g) and (h) reflect, for each named executive officer, the number and
market value of unvested restricted stock shares and RSUs which had been granted as of
September 26, 2008, but which remained subject to additional vesting requirements. Those
requirements depend upon the officer’s continued employment with the Company. Scheduled
vesting of all outstanding restricted stock shares, RSUs and performance shares (based on
achievement at target values) for each of the named executive officers is as follows:
Edward D. Christopher J. George R. Naren K.
Vesting Date Breen Coughlin Oliver John Evard Gursahaney
Number of Share Underlying Vesting Awards
2008
9/30/2008 ....................... 35,818 16,417 4,477 6,722
11/21/2008 ...................... 44,024 20,187 5,584 9,664
11/22/2008 ...................... 35,000 15,000 4,500 2,675
2009
7/2/2009 ....................... 31,677 14,604 7,505 4,158 7,505
7/10/2009 ....................... 49,771
11/21/2009 ...................... 44,023 20,186 5,583 9,663
2010
6/30/2010 ....................... 93,700 43,200 22,200 12,300 22,200
7/2/2010 ....................... 31,676 14,604 7,505 4,158 7,505
11/21/2010 ...................... 44,023 20,185 5,582 9,663
2011
7/2/2011 ....................... 31,675 14,604 7,504 4,158 7,504
2012
8/18/2012 ....................... 11,200 11,200
(3) Amounts in columns (i) and (j) reflect the number and market value, as of September 26, 2008, of
performance shares that would be earned if the performance goals related to these awards were
met at the target level at the end of the performance period. If the minimum performance
threshold is not met (i.e., Tyco’s total shareholder return over the performance period is not equal
to or better than the total shareholder return of the top 65% of the companies constituting the
S&P 500 Industrials Index), there will be no payout. The performance shares were granted in July
2007 in connection with the accelerated fiscal 2008 long-term incentive compensation grant
described in the proxy statement for the 2008 Annual General Meeting. All performance shares
will vest and become payable in shares of the Company’s common stock on June 30, 2010. The
number of shares that will actually be earned will depend on the Company’s three-year shareholder
return as compared to the total shareholder return of the S & P Industrials Index.
52 2009 Proxy Statement
