ADT 2008 Annual Report Download - page 5
Download and view the complete annual report
Please find page 5 of the 2008 ADT annual report below. You can navigate through the pages in the report by either clicking on the pages listed below, or by using the keyword search tool below to find specific information within the annual report.-
 1
1 -
 2
2 -
 3
3 -
 4
4 -
 5
5 -
 6
6 -
 7
7 -
 8
8 -
 9
9 -
 10
10 -
 11
11 -
 12
12 -
 13
13 -
 14
14 -
 15
15 -
 16
16 -
17
-
18
-
19
-
20
-
21
-
22
-
23
-
24
-
25
-
26
-
27
-
28
-
29
-
30
-
31
-
32
-
33
-
34
-
35
-
36
-
37
-
38
-
39
-
40
-
41
-
42
-
43
-
44
-
45
-
46
-
47
-
48
-
49
-
50
-
51
-
52
-
53
-
54
-
55
-
56
-
57
-
58
-
59
-
60
-
61
-
62
-
63
-
64
-
65
-
66
-
67
-
68
-
69
-
70
-
71
-
72
-
73
-
74
-
75
-
76
-
77
-
78
-
79
-
80
-
81
-
82
-
83
-
84
-
85
-
86
-
87
-
88
-
89
-
90
-
91
-
92
-
93
-
94
-
95
-
96
-
97
-
98
-
99
-
100
-
101
-
102
-
103
-
104
-
105
-
106
-
107
-
108
-
109
-
110
-
111
-
112
-
113
-
114
-
115
-
116
-
117
-
118
-
119
-
120
-
121
-
122
-
123
-
124
-
125
-
126
-
127
-
128
-
129
-
130
-
131
-
132
-
133
-
134
-
135
-
136
-
137
-
138
-
139
-
140
-
141
-
142
-
143
-
144
-
145
-
146
-
147
-
148
-
149
-
150
-
151
-
152
-
153
-
154
-
155
-
156
-
157
-
158
-
159
-
160
-
161
-
162
-
163
-
164
-
165
-
166
-
167
-
168
-
169
-
170
-
171
-
172
-
173
-
174
-
175
-
176
-
177
-
178
-
179
-
180
-
181
-
182
-
183
-
184
-
185
-
186
-
187
-
188
-
189
-
190
-
191
-
192
-
193
-
194
-
195
-
196
-
197
-
198
-
199
-
200
-
201
-
202
-
203
-
204
-
205
-
206
-
207
-
208
-
209
-
210
-
211
-
212
-
213
-
214
-
215
-
216
-
217
-
218
-
219
-
220
-
221
-
222
-
223
-
224
-
225
-
226
-
227
-
228
-
229
-
230
-
231
-
232
-
233
-
234
-
235
-
236
-
237
-
238
-
239
-
240
-
241
-
242
-
243
-
244
-
245
-
246
-
247
-
248
-
249
-
250
-
251
-
252
-
253
-
254
-
255
-
256
-
257
-
258
-
259
-
260
-
261
-
262
-
263
-
264
-
265
-
266
-
267
-
268
-
269
-
270
-
271
-
272
-
273
-
274
-
275
-
276
-
277
-
278
-
279
-
280
-
281
-
282
-
283
 |
 |
CHAIRMAN’S LETTER
TO OUR SHAREHOLDERS:
6
Tyco International delivered strong results and made substantial
operational and strategic progress in the irst full year since spinning o
its electronics and healthcare businesses. We inished iscal year 2008
in sound inancial health, with a strong balance sheet, good cash low
and the lexibility to strengthen our diverse mix of businesses even
during this time of uncertainty and turbulence in the global economy.
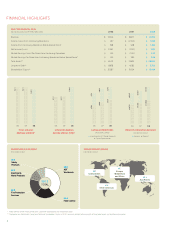
Revenue increased 9% from iscal 2007 to $20.2 billion. Organic
revenue growth, which excludes the impact of acquisitions, divestitures
and foreign currency translation, was 5%—similar to the growth rate
of the previous year. We were particularly encouraged by the growth of
our service revenue, which increased 7%. This portion of our business,
which includes a signiicant amount of recurring or contractual
revenue, constitutes 35% of our total revenue stream and is an important
area of focus for our company.
We reported income from continuing operations of $1.1 billion, or
$2.25 per diluted share, compared to a net loss from continuing
operations of $2.5 billion, or $5.10 per share, for iscal 2007. Included
in these igures are a number of special items. (The special items for
2008 related mostly to ongoing restructuring activities to enhance
the eiciency of our businesses, plus separation costs. Those for 2007
consisted primarily of a charge for the settlement of a class-action
lawsuit involving the company’s former management team, plus
separation costs and restructuring charges.) Excluding special items,
2008 income from continuing operations totaled $1.5 billion, or $3.06
per diluted share, compared with 2007 income from continuing
operations of $948 million, or $1.89 per share.
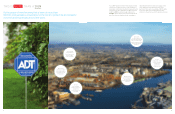
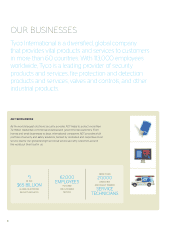
All of our business segments contributed to the growth in revenue
and income. At ADT Worldwide, our largest segment, revenue grew
5% overall and 2% organically. Recurring revenue grew organically
by nearly 5%, fueled by a healthy increase in average revenue per user.
ADT contributed 40% of our total revenue last year.
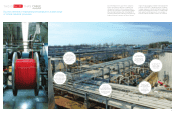
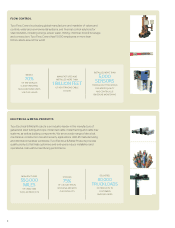
Flow Control, our second-largest segment, delivered very strong
results for the year, including total revenue growth of 17% and organic
revenue growth of 9%. The revenue growth was led by our valves
business, which serves a broad range of customers in the energy,
process and water industries. Flow Control generated 22% of our
revenue in iscal 2008.
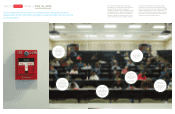
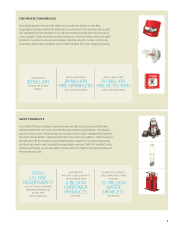
We made considerable progress as well in our Fire Protection Services
segment—both in North America and internationally. Revenue
increased by 6% overall and by 2% organically. Our North American
SimplexGrinnell business, which represents about 60% of total segment
revenue, derives more than half of its revenue from service activities.
As a whole, Fire Protection Services generated 18% of the company’s
revenue last year.
Electrical & Metal Products achieved revenue growth of 15% and
organic revenue growth of 13%. A strong pricing environment for our
products, combined with better operating eiciency, doubled our
operating margin. This segment accounted for 11% of the company’s
2008 revenue.
Finally, Tyco Safety Products achieved revenue growth of nearly
13% and organic revenue growth of 8%. The improvement was driven
by higher sales to emerging markets and higher prices, particularly
for ire suppression systems. Our operating margin continued to be
strong even as we increased our investment in sales, marketing and
research and development (R&D). Tyco Safety Products contributed
9% of the company’s revenue in iscal 2008.
RELYING ON OUR FUNDAMENTAL STRENGTHS
It’s diicult to predict how long or severe the slowdown in the global
economy will be. But in this challenging economic environment, Tyco’s
fundamental strengths provide the foundation we need to weather
the economic storm and, in fact, improve our market position. We are
a inancially sound company with a strong balance sheet and solid
credit ratings that were raised last fall. Further, we generate strong cash
low that gives us the lexibility to invest in the growth of our businesses
and to return capital to our shareholders. During 2008, we completed a
$1 billion share repurchase program, launched a new $1 billion program
and increased our quarterly dividend by 33% to 20 cents per share.
Equally important, we have made excellent progress in improving our
cost structure. Last year, our Operational Excellence initiatives, including
strategic sourcing and Six Sigma, yielded nearly $300 million in savings
for Tyco. We continue to look for further cost-reduction opportunities
through these ongoing programs.