ADT 2008 Annual Report Download - page 149
Download and view the complete annual report
Please find page 149 of the 2008 ADT annual report below. You can navigate through the pages in the report by either clicking on the pages listed below, or by using the keyword search tool below to find specific information within the annual report.-
 1
1 -
2
-
3
-
4
-
5
-
6
-
7
-
8
-
9
-
10
-
11
-
12
-
13
-
14
-
15
-
16
-
17
-
18
-
19
-
20
-
21
-
22
-
23
-
24
-
25
-
26
-
27
-
28
-
29
-
30
-
31
-
32
-
33
-
34
-
35
-
36
-
37
-
38
-
39
-
40
-
41
-
42
-
43
-
44
-
45
-
46
-
47
-
48
-
49
-
50
-
51
-
52
-
53
-
54
-
55
-
56
-
57
-
58
-
59
-
60
-
61
-
62
-
63
-
64
-
65
-
66
-
67
-
68
-
69
-
70
-
71
-
72
-
73
-
74
-
75
-
76
-
77
-
78
-
79
-
80
-
81
-
82
-
83
-
84
-
85
-
86
-
87
-
88
-
89
-
90
-
91
-
92
-
93
-
94
-
95
-
96
-
97
-
98
-
99
-
100
-
101
-
102
-
103
-
104
-
105
-
106
-
107
-
108
-
109
-
110
-
111
-
112
-
113
-
114
-
115
-
116
-
117
-
118
-
119
-
120
-
121
-
122
-
123
-
124
-
125
-
126
-
127
-
128
-
129
-
130
-
131
-
132
-
133
-
134
-
135
-
136
-
137
-
138
-
 139
139 -
 140
140 -
 141
141 -
 142
142 -
 143
143 -
 144
144 -
 145
145 -
 146
146 -
 147
147 -
 148
148 -
 149
149 -
 150
150 -
 151
151 -
 152
152 -
 153
153 -
 154
154 -
 155
155 -
 156
156 -
 157
157 -
 158
158 -
 159
159 -
160
-
161
-
162
-
163
-
164
-
165
-
166
-
167
-
168
-
169
-
170
-
171
-
172
-
173
-
174
-
175
-
176
-
177
-
178
-
179
-
180
-
181
-
182
-
183
-
184
-
185
-
186
-
187
-
188
-
189
-
190
-
191
-
192
-
193
-
194
-
195
-
196
-
197
-
198
-
199
-
200
-
201
-
202
-
203
-
204
-
205
-
206
-
207
-
208
-
209
-
210
-
211
-
212
-
213
-
214
-
215
-
216
-
217
-
218
-
219
-
220
-
221
-
222
-
223
-
224
-
225
-
226
-
227
-
228
-
229
-
230
-
231
-
232
-
233
-
234
-
235
-
236
-
237
-
238
-
239
-
240
-
241
-
242
-
243
-
244
-
245
-
246
-
247
-
248
-
249
-
250
-
251
-
252
-
253
-
254
-
255
-
256
-
257
-
258
-
259
-
260
-
261
-
262
-
263
-
264
-
265
-
266
-
267
-
268
-
269
-
270
-
271
-
272
-
273
-
274
-
275
-
276
-
277
-
278
-
279
-
280
-
281
-
282
-
283
 |
 |

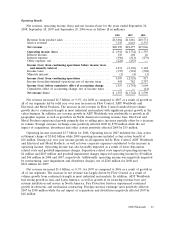
contractual service agreement to a time and material basis. Internationally, our attrition rate continued
to improve.
Operating income in 2008 increased $68 million, or 8.1%, as compared to 2007. Factors that
positively impacted operating income included increased volume, particularly our higher margin
recurring revenue, operational efficiencies, including those achieved from restructuring activities in
Europe, lower depreciation and amortization expense and lower long-lived asset impairment charges.
The decrease in depreciation and amortization expense occurred primarily in North America and
resulted from changes to the depreciation method and estimated useful lives for pooled subscriber
assets and changes to the estimated useful lives of dealer intangible assets. The reduction in
depreciation and amortization expense was partially offset by increased net expenses of $51 million,
which primarily related to converting customers from analog to digital signal transmissions in North
America. Results for 2007 include goodwill impairment charges due to the reorganization of our
management and segment reporting structure following the Separation.
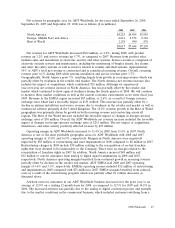
Net revenue for ADT Worldwide increased 6.1% during 2007, with product revenue up 7.4% and
service revenue up 5.5%, as compared to 2006. The 2.7% revenue growth in North America resulted
largely from an increase in commercial installations, primarily in the retailer market, as well as an
increase in the recurring revenue base. Revenue in the EMEA region grew 9.8%, primarily driven by
favorable changes in foreign currency exchange rates. The 11.9% revenue growth in the Rest of World
geographies was primarily driven by strong growth in Asia and Latin America and, to a lesser extent,
favorable changes in foreign currency exchange rates. Overall, net revenue was favorably affected by
$213 million due to changes in foreign currency exchange rates while the net impact of acquisitions and
divestitures unfavorably impacted net revenue by $3 million.
Operating income of $842 million in 2007 decreased $65 million from $907 million in 2006. Factors
that positively impacted operating income included increased volume, operational efficiencies and
reductions to depreciation and amortization expense, of $26 million. The decrease to depreciation and
amortization expense resulted from changes to the depreciation method and estimated useful lives for
pooled subscriber assets and changes to the estimated useful lives of dealer intangible assets. These
increases were more than offset by a goodwill impairment charge of $46 million, due to the
reorganization of our management and segment reporting structure, as well as increased investment in
selling and marketing in Americas and Asia. In addition, results for 2007 included restructuring, asset
impairment and divestiture charges, net of $83 million, which were primarily related to actions to
improve field efficiencies and consolidating certain administrative functions in Europe, and an
impairment of certain indefinite lived intangible assets. Restructuring, asset impairment and divestiture
charges, net were $5 million in 2006.
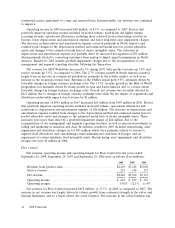
Flow Control
Net revenue, operating income and operating margin for Flow Control for the years ended
September 26, 2008, September 28, 2007 and September 29, 2006 were as follows ($ in millions):
2008 2007 2006
Revenue from product sales ............................. $4,201 $3,618 $3,002
Service revenue ...................................... 217 148 133
Net revenue ........................................ $4,418 $3,766 $3,135
Operating income .................................... $ 618 $ 457 $ 356
Operating margin ..................................... 14.0% 12.1% 11.4%
Net revenue for Flow Control increased $652 million, or 17.3%, in 2008 as compared to 2007. The
increase in net revenue was largely driven by volume growth from continued strength in the valves and
thermal businesses, and to a lesser extent, the water business. The increase in the valves business was
46 2008 Financials