ADT 2008 Annual Report Download - page 68
Download and view the complete annual report
Please find page 68 of the 2008 ADT annual report below. You can navigate through the pages in the report by either clicking on the pages listed below, or by using the keyword search tool below to find specific information within the annual report.-
 1
1 -
2
-
3
-
4
-
5
-
6
-
7
-
8
-
9
-
10
-
11
-
12
-
13
-
14
-
15
-
16
-
17
-
18
-
19
-
20
-
21
-
22
-
23
-
24
-
25
-
26
-
27
-
28
-
29
-
30
-
31
-
32
-
33
-
34
-
35
-
36
-
37
-
38
-
39
-
40
-
41
-
42
-
43
-
44
-
45
-
46
-
47
-
48
-
49
-
50
-
51
-
52
-
53
-
54
-
55
-
56
-
57
-
 58
58 -
 59
59 -
 60
60 -
 61
61 -
 62
62 -
 63
63 -
 64
64 -
 65
65 -
 66
66 -
 67
67 -
 68
68 -
 69
69 -
 70
70 -
 71
71 -
 72
72 -
 73
73 -
 74
74 -
 75
75 -
 76
76 -
 77
77 -
 78
78 -
79
-
80
-
81
-
82
-
83
-
84
-
85
-
86
-
87
-
88
-
89
-
90
-
91
-
92
-
93
-
94
-
95
-
96
-
97
-
98
-
99
-
100
-
101
-
102
-
103
-
104
-
105
-
106
-
107
-
108
-
109
-
110
-
111
-
112
-
113
-
114
-
115
-
116
-
117
-
118
-
119
-
120
-
121
-
122
-
123
-
124
-
125
-
126
-
127
-
128
-
129
-
130
-
131
-
132
-
133
-
134
-
135
-
136
-
137
-
138
-
139
-
140
-
141
-
142
-
143
-
144
-
145
-
146
-
147
-
148
-
149
-
150
-
151
-
152
-
153
-
154
-
155
-
156
-
157
-
158
-
159
-
160
-
161
-
162
-
163
-
164
-
165
-
166
-
167
-
168
-
169
-
170
-
171
-
172
-
173
-
174
-
175
-
176
-
177
-
178
-
179
-
180
-
181
-
182
-
183
-
184
-
185
-
186
-
187
-
188
-
189
-
190
-
191
-
192
-
193
-
194
-
195
-
196
-
197
-
198
-
199
-
200
-
201
-
202
-
203
-
204
-
205
-
206
-
207
-
208
-
209
-
210
-
211
-
212
-
213
-
214
-
215
-
216
-
217
-
218
-
219
-
220
-
221
-
222
-
223
-
224
-
225
-
226
-
227
-
228
-
229
-
230
-
231
-
232
-
233
-
234
-
235
-
236
-
237
-
238
-
239
-
240
-
241
-
242
-
243
-
244
-
245
-
246
-
247
-
248
-
249
-
250
-
251
-
252
-
253
-
254
-
255
-
256
-
257
-
258
-
259
-
260
-
261
-
262
-
263
-
264
-
265
-
266
-
267
-
268
-
269
-
270
-
271
-
272
-
273
-
274
-
275
-
276
-
277
-
278
-
279
-
280
-
281
-
282
-
283
 |
 |

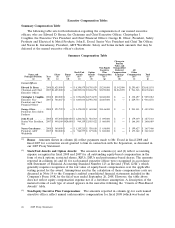
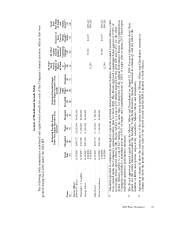
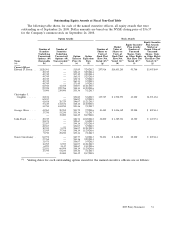
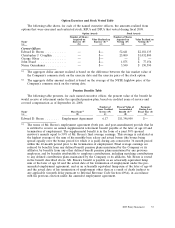
Outstanding Equity Awards at Fiscal Year-End Table
The following table shows, for each of the named executive officers, all equity awards that were
outstanding as of September 26, 2008. Dollar amounts are based on the NYSE closing price of $36.37
for the Company’s common stock on September 26, 2008.
Option Awards Stock Awards
Equity Incentive
Equity Incentive Plan Awards:
Market Plan Awards: Market or
Number of Number of Number of Value of Number of Payout Value of
Securities Securities Shares or Shares or Unearned Unearned
Underlying Underlying Units of Units of Shares, Units Shares, Units
Unexercised Unexercised Option Option Stock That Stock That or Other Rights or Other Rights
Options: (#) Options: (#) Exercise Expiration Have Not Have Not That Have Not That Have Not
Name Exercisable Unexercisable(1) Price ($) Date Vested (#)(2) Vested ($)(2) Vested (#)(3) Vested ($)(3)
(a) (b) (c) (e) (f) (g) (h) (i) (j)
Current Officers
Edward D. Breen . . 1,828,301 — $15.89 7/24/2012 297,916 $10,835,205 93,700 $3,407,869
49,749 — $52.43 3/25/2014
49,749 — $57.19 3/25/2014
49,749 — $63.55 3/25/2014
49,749 — $58.78 3/9/2015
49,749 — $65.13 3/9/2015
49,749 — $71.49 3/9/2015
82,916 41,458 $46.07 11/21/2015
99,928 299,786 $48.14 11/20/2016
73,000 219,000 $53.36 7/1/2017
Christopher J.
Coughlin ...... 24,874 — $56.60 3/6/2015 135,787 $ 4,938,573 43,200 $1,571,184
62,187 — $56.87 3/9/2015
41,458 20,729 $46.07 11/21/2015
47,210 141,631 $48.14 11/20/2016
34,750 104,250 $53.36 7/1/2017
George Oliver .... 41,965 20,982 $43.72 7/9/2016 83,485 $ 3,036,349 22,200 $ 807,414
17,750 53,250 $53.36 7/1/2017
— 35,000 $44.49 8/17/2018
John Evard ...... 49,749 — $26.74 12/18/2012 38,200 $ 1,389,334 12,300 $ 447,351
24,874 — $22.67 3/6/2013
22,387 — $44.16 3/25/2014
22,387 — $56.87 3/9/2015
10,945 5,472 $46.07 11/21/2015
12,589 37,768 $48.14 11/20/2016
9,750 29,250 $53.36 7/1/2017
Naren Gursahaney . 84,978 — $23.77 3/2/2013 72,101 $ 2,622,313 22,200 $ 807,414
37,768 — $44.16 3/25/2014
31,473 — $56.87 3/9/2015
16,785 8,393 $46.07 11/21/2015
6,295 3,147 $48.67 1/11/2016
22,031 66,094 $48.14 11/20/2016
17,750 53,250 $53.36 7/1/2017
— 35,000 $44.49 8/17/2018
(1) Vesting dates for each outstanding option award for the named executive officers are as follows:
2009 Proxy Statement 51