TCF Bank 2005 Annual Report Download - page 90
Download and view the complete annual report
Please find page 90 of the 2005 TCF Bank annual report below. You can navigate through the pages in the report by either clicking on the pages listed below, or by using the keyword search tool below to find specific information within the annual report.-
 1
1 -
2
-
3
-
4
-
5
-
6
-
7
-
8
-
9
-
10
-
11
-
12
-
13
-
14
-
15
-
16
-
17
-
18
-
19
-
20
-
21
-
22
-
23
-
24
-
25
-
26
-
27
-
28
-
29
-
30
-
31
-
32
-
33
-
34
-
35
-
36
-
37
-
38
-
39
-
40
-
41
-
42
-
43
-
44
-
45
-
46
-
47
-
48
-
49
-
50
-
51
-
52
-
53
-
54
-
55
-
56
-
57
-
58
-
59
-
60
-
61
-
62
-
63
-
64
-
65
-
66
-
67
-
68
-
69
-
70
-
71
-
72
-
73
-
74
-
75
-
76
-
77
-
78
-
79
-
 80
80 -
 81
81 -
 82
82 -
 83
83 -
 84
84 -
 85
85 -
 86
86 -
 87
87 -
 88
88 -
 89
89 -
 90
90 -
 91
91 -
 92
92 -
 93
93 -
 94
94 -
 95
95 -
 96
96 -
 97
97 -
 98
98 -
 99
99 -
 100
100 -
101
-
102
-
103
-
104
-
105
-
106
 |
 |

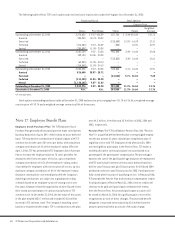
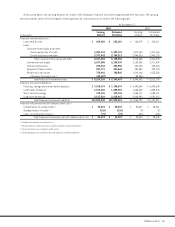
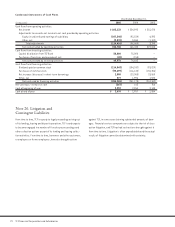
70 TCF Financial Corporation and Subsidiaries
Condensed Statements of Cash Flows
Year Ended December 31,
(In thousands) 2005 2004 2003
Cash flows from operating activities:
Net income $ 265,132 $ 254,993 $ 215,878
Adjustments to reconcile net income to net cash provided by operating activities:
Equity in undistributed earnings of subsidiary (107,548) (92,524) 4,292
Other, net (2,878) 3,964 (1,102)
Total adjustments (110,426) (88,560) 3,190
Net cash provided by operating activities 154,706 166,433 219,068
Cash flows from investing activities:
Capital distribution from TCF Bank 50,000 75,000 –
Purchases of premises and equipment, net (28) (155) –
Net cash provided by investing activities 49,972 74,845 –
Cash flows from financing activities:
Dividends paid on common stock (114,543) (104,037) (93,029)
Purchases of common stock (93,499) (116,134) (150,356)
Net increase (decrease) in short-term borrowings 2,500 (23,000) 23,500
Other, net 577 1,996 1,523
Net cash used by financing activities (204,965) (241,175) (218,362)
Net (decrease) increase in cash (287) 103 706
Cash at beginning of year 2,957 2,854 2,148
Cash at end of year $ 2,670 $ 2,957 $ 2,854
Note 26. Litigation and
Contingent Liabilities
From time to time, TCF is a party to legal proceedings arising out
of its lending, leasing and deposit operations. TCF is and expects
to become engaged in a number of foreclosure proceedings and
other collection actions as part of its lending and leasing collec-
tion activities. From time to time, borrowers and other customers,
or employees or former employees, have also brought actions
against TCF, in some cases claiming substantial amounts of dam-
ages. Financial services companies are subject to the risk of class
action litigation, and TCF has had such actions brought against it
from time to time. Litigation is often unpredictable and the actual
results of litigation cannot be determined with certainty.