TCF Bank 2005 Annual Report Download - page 40
Download and view the complete annual report
Please find page 40 of the 2005 TCF Bank annual report below. You can navigate through the pages in the report by either clicking on the pages listed below, or by using the keyword search tool below to find specific information within the annual report.-
 1
1 -
2
-
3
-
4
-
5
-
6
-
7
-
8
-
9
-
10
-
11
-
12
-
13
-
14
-
15
-
16
-
17
-
18
-
19
-
20
-
21
-
22
-
23
-
24
-
25
-
26
-
27
-
28
-
29
-
 30
30 -
 31
31 -
 32
32 -
 33
33 -
 34
34 -
 35
35 -
 36
36 -
 37
37 -
 38
38 -
 39
39 -
 40
40 -
 41
41 -
 42
42 -
 43
43 -
 44
44 -
 45
45 -
 46
46 -
 47
47 -
 48
48 -
 49
49 -
 50
50 -
51
-
52
-
53
-
54
-
55
-
56
-
57
-
58
-
59
-
60
-
61
-
62
-
63
-
64
-
65
-
66
-
67
-
68
-
69
-
70
-
71
-
72
-
73
-
74
-
75
-
76
-
77
-
78
-
79
-
80
-
81
-
82
-
83
-
84
-
85
-
86
-
87
-
88
-
89
-
90
-
91
-
92
-
93
-
94
-
95
-
96
-
97
-
98
-
99
-
100
-
101
-
102
-
103
-
104
-
105
-
106
 |
 |

20 TCF Financial Corporation and Subsidiaries
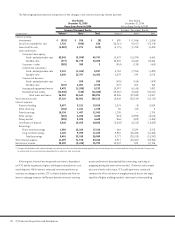
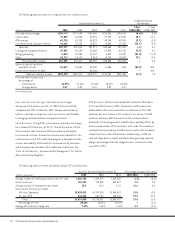
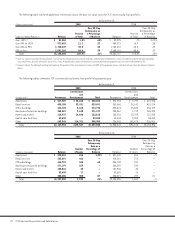
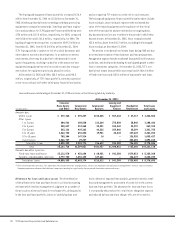
The following table presents the components of the changes in net interest income by volume and rate:
Year Ended Year Ended
December 31, 2005 December 31, 2004
Versus Same Period in 2004 Versus Same Period in 2003
Increase (Decrease) Due to Increase (Decrease) Due to
(In thousands) Volume(1) Rate(1) Total Volume(1) Rate(1) Total
Interest income:
Investments $ (925) $ 920 $ (5) $ 890 $ (1,946) $ (1,056)
Securities available for sale 1,726 (890) 836 (18,761) (4,417) (23,178)
Loans held for sale (4,883) 4,271 (612) (5,775) (2,708) (8,483)
Loans and leases:
Consumer home equity:
Fixed- and adjustable-rate 53,342 (3,595) 49,747 15,837 (10,374) 5,463
Variable-rate (377) 33,775 33,398 28,302 (2,634) 25,668
Consumer – other (382) 385 3 (524) (139) (663)
Commercial real estate:
Fixed- and adjustable-rate 9,131 (1,104) 8,027 5,754 (7,253) (1,499)
Variable-rate 2,545 13,757 16,302 2,879 199 3,078
Commercial business:
Fixed- and adjustable-rate – 205 205 (425) (184) (609)
Variable-rate (247) 6,007 5,760 (247) 405 158
Leasing and equipment finance 9,432 (1,200) 8,232 13,597 (6,145) 7,452
Residential real estate (12,535) (145) (12,680) (19,557) (5,484) (25,041)
Total loans and leases 56,353 52,641 108,994 43,545 (29,538) 14,007
Total interest income 47,122 62,091 109,213 13,444 (32,154) (18,710)
Interest expense:
Premier checking 9,897 3,121 13,018 2,874 (5) 2,869
Other checking (102) 1,241 1,139 65 (62) 3
Premier savings 10,134 1,407 11,541 1,705 – 1,705
Other savings (654) 4,288 3,634 (523) (2,990) (3,513)
Money market (555) 5,203 4,648 (566) (889) (1,455)
Certificates of deposit 5,242 15,603 20,845 (5,508) (8,315) (13,823)
Borrowings:
Short-term borrowings 1,902 15,264 17,166 684 2,529 3,213
Long-term borrowings 2,125 9,298 11,423 9,981 (28,436) (18,455)
Total borrowings 5,401 23,188 28,589 9,777 (25,019) (15,242)
Total interest expense 11,499 71,915 83,414 3,911 (33,367) (29,456)
Net interest income 35,209 (9,410) 25,799 10,247 499 10,746
(1) Changes attributable to the combined impact of volume and rate have been allocated proportionately to the change due to volume and the change due to rate. Changes due
to volume and rate are calculated independently for each line item presented.
Achieving net interest income growth over time is dependent
on TCF’s ability to generate higher-yielding assets and lower-cost
retail deposits. While interest rates and consumer preferences
continue to change over time, TCF is relatively balanced from an
interest rate gap measure (difference between interest-earning
assets and interest-bearing liabilities maturing, repricing, or
prepaying during the next twelve months). If interest rates remain
at current levels or decrease, TCF could experience continued
compression of its net interest margin primarily due to the ongo-
ing shift of higher yielding variable-rate loans to lower yielding